1. Overview
In practice, it is often necessary to prove the functionality of a construction with regard to moisture protection. This increasingly requires the use of hygrothermal simulation. In this tutorial, the possibilities of an evaluation will be mentioned first. Then it will be shown how these verifications can be carried out with DELPHIN. The new automatic evaluation, which has been available since version 6.1.5, will also be discussed.
2. Moisture assessment
The question 'does this construction work?' is often asked. What does that actually mean? This question is usually answered by demonstrating that no relevant moisture damage will occur during the period of use (warranty?). The following questions must therefore be answered:
-
What moisture damage is there in the first place?
-
Which of these damages can actually occur in my specific construction?
-
How do I prove that there is no damage?
In German practice, DIN 4108-3 from 2018 is primarily used for the assessment. Also relevant are:
-
WTA technical bulletins 6.1 and 6.2 with general information on hygrothermal simulation
-
WTA leaflet 6.3 for mold assessment (currently being revised)
-
WTA leaflet 6.5 for interior insulation systems
-
WTA leaflet 6.8 for timber constructions
and
-
ASHREA 160
-
ISO 15026
for international use
2.1. Settling process - DIN 4108-3 (2018) D.7.2
Since hygrothermal simulations work with a realistic climate, the first question is usually the transient state. Here, a construction is simulated over several years and the same climate is used for each year (cyclical climate). All damage forecasts described below assume the steady-state condition. DIN 4108-3 2018 uses the following criteria in Chapter D.7.2:
-
a climate data set is applied cyclically
-
the water content of the entire construction is evaluated
-
Settled means: water content at the end of a year changes by less than 1% in relation to the previous year
-
instead of 'change' one should rather evaluate 'increase', because drying out constructions are usually not a problem
-
whereby, strictly speaking, drying out constructions are not in equilibrium
-
-
-
equilibrium should generally be reached in 10 years
-
layers that carry a lot of water (green roofs, weather protection shells, etc.) should not be taken into account
In DELPHIN you can start with an average calculation period of 5 years. If no equilibrium can be reached during this time, the time should be extended up to 10 years and the calculation continued. Whether equilibrium has been reached can be seen from the progression of the moisture content of the entire construction. An automatic evaluation is possible for 1D constructions. Other standards or codes of practice use the following criteria:
-
WTA leaflet 6.2
-
currently also 1% but no minimum and maximum total time
-
-
ISO 15026:2022
-
3 years minimum calculation time
-
5 to 10 years are recommended
-
increase in annual average water content should be less than or equal to 1%
-
If the water content continues to increase but the growth is less than 1%, the calculation time should be extended to the lifetime of the structure (at least 30 years)
-
Damage must not occur during this time
-
-
ASHRAE 160-2021
-
at least 5 years calculation time
-
maximum 10 years calculation time
-
the maximum water content of the year before last must be equal to or less than that of the last year
-
2.2. Moisture damage
Moisture in building structures can cause various types of damage:
-
Biological damage
-
Mold
-
Wood-destroying fungi
-
Wood-destroying insects
-
Algae
-
-
Ice formation in the construction (frost damage)
-
Salt crystallization
-
Thermal and hygric expansion (swelling and shrinkage)
-
Corrosion
-
Metals
-
Concrete
-
The individual types of damage and the associated assessment criteria are explained in more detail below. First come the assessments already described in the standards.
2.2.1. Frost damage - DIN 4108-3 (2018) D.7.5
The standard describes the following procedure:
If materials are presumed not to be frost-resistant, there is a risk of damage if:
-
degree of saturation greater than 30%
-
does not apply if the equilibrium humidity is <95%
-
-
temperature ≤-5°C
-
if critical limit values to avoid frost damage are known, these should be applied
The critical 10 mm of the affected material layer must be examined. These are usually the outer material layers such as the exterior plaster and/or the adjoining supporting structure (especially bricks).
How does this work in DELPHIN?
-
Selecting one or more critical areas (high moisture content, low temperature)
-
Generate and assign an output of type 'IceCriteriaDIN4108_3'
-
Spatially as individual values (frost distribution color chart) or as a maximum (line chart)
-
Temporally as an integral (sum over all points in time)
-
With such an output, any value above 0 indicates a possible risk of frost damage. An automatic evaluation exists for 1D constructions (see below).
Note
DELPHIN contains a model for the direct calculation of the amount of ice. However, there are no evaluation criteria for the values determined there.
2.2.2. Wood destruction - DIN 4108-3 (2018) D.7.4
The assessment of possible wood destruction generally focuses on wood-damaging fungi. However, possible damage caused by insects is also included. Furthermore, reference is made to constructive limit values from DIN 68800-2.
-
Wood moisture content must not exceed 20M% (solid wood)
-
permissible in the first 3 months (construction moisture)
-
other limit values for wood-based materials (see below)
-
represents a constructive limit value
-
for boards up to 3cm thick, the entire board should be assessed, otherwise the lower 3cm
-
-
Assessment according to WTA 6.8
-
should be carried out in addition to the first assessment
-
evaluates wood-destroying fungi
-
the critical 10mm of the material should be assessed
-
For wood-based materials, the permissible wood moisture content can be tested in accordance with DIN 68800-2.
Permissible wood moisture content in service class 0 according to DIN 68800-2
| moisture resistance range according to EN 13986 | permissible moisture content in M% | service class according to EN 1995-1-1 |
|---|---|---|
Dry area |
15 |
1 |
Damp area |
18 |
2 |
Outdoor area |
21 |
3 |
The following outputs are to be used for DELPHIN (all as spatial mean values):
-
moisture content in mass percent (criterion 1)
-
temporal as daily averages
-
-
Temperature and relative humidity (criterion 2)
-
normal hourly values can be used (PostProc 2 itself generates daily averages in the damage model)
-
The outputs can be checked in PostProc 2. For criterion 1, the wood moisture is simply displayed as a line graph and checked to see if the respective limit value is exceeded. For criterion 2, a model must be used (see PostProc 2 - Models). The model to be used here is called 'WTA Wood Destruction Model'. There is another model for wood degradation in PostProc 2 which is called 'VTT wood degradation'. This model was developed by an employee of VTT, Hannu Viitanen, and is widely used internationally. The result of the WTA model is a diagram like the following.
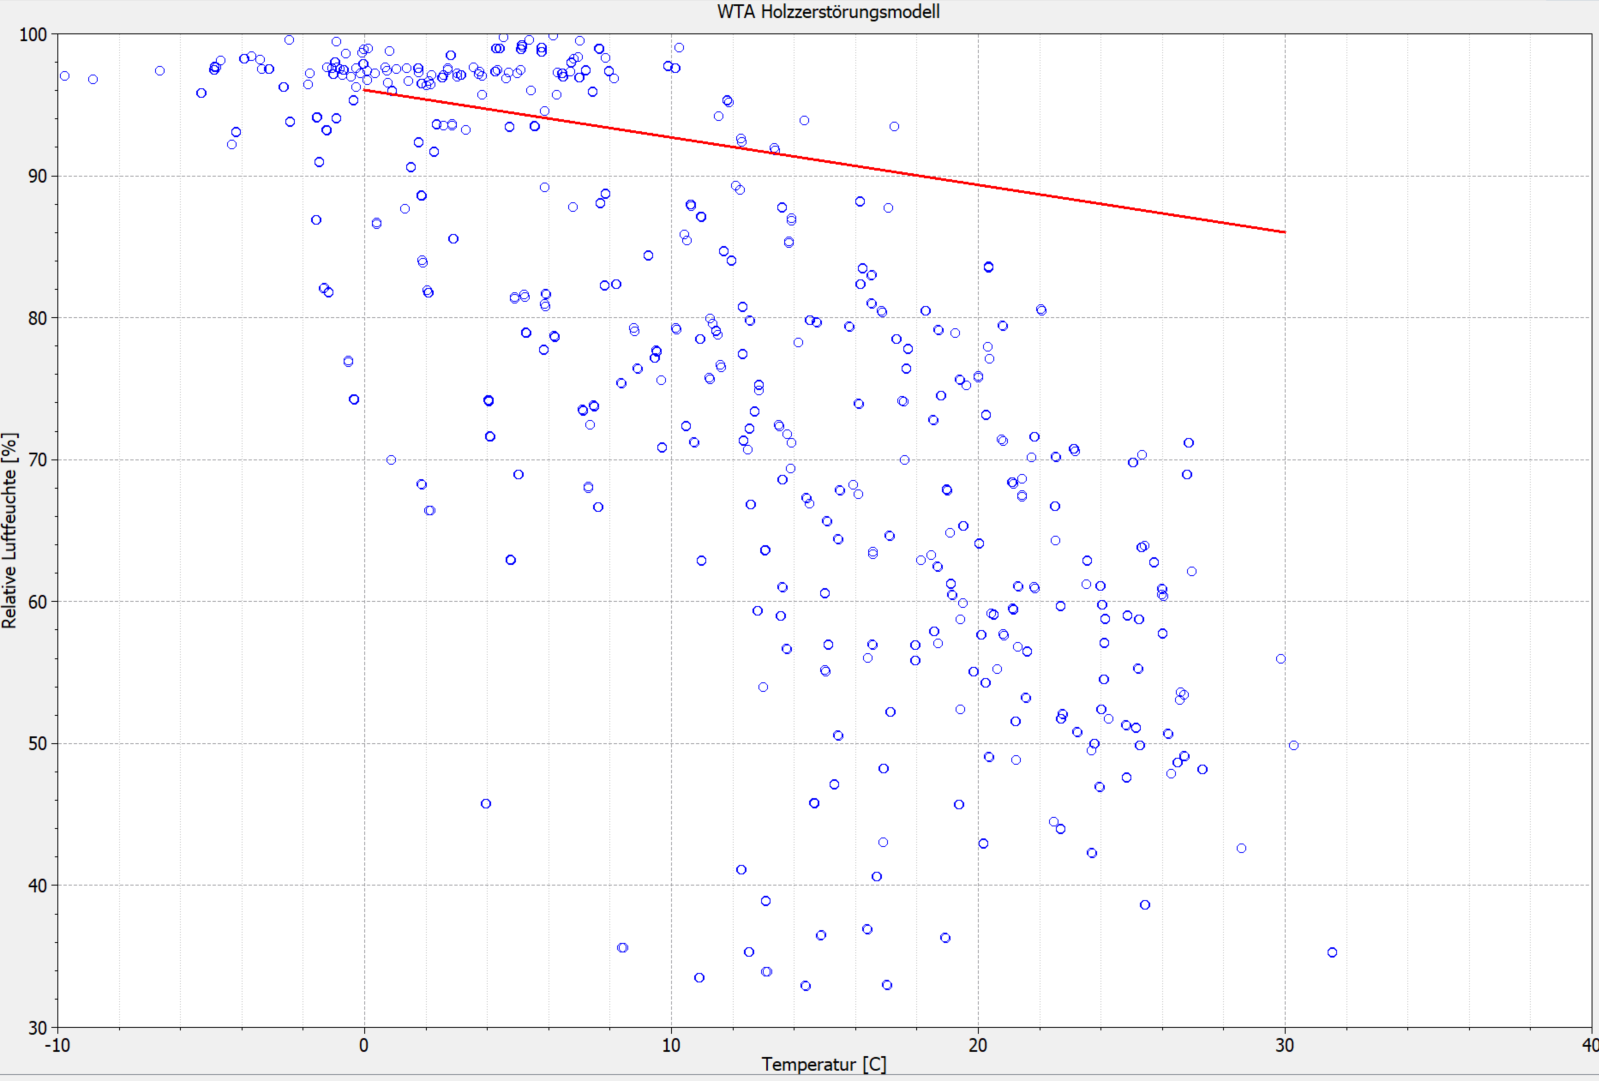
The red line in the diagram indicates the limit value. The blue points are the daily averages of temperature and relative humidity at the location to be evaluated. If all points are below the red line, there is no risk of wood damage.
2.2.3. Assessment of critical moisture conditions - DIN 4108-3 (2018) D.7.3
DIN 4108-3 describes a test for critical water content in chapter D.7.3. Here, individual material layers (layer, edges, material boundaries) are to be tested with regard to a material-specific critical water content. What exactly causes this critical water content and how it is to be determined is not described. One possibility here would be the water content in open-pored materials (e.g. fiber insulation materials) above which the water can no longer be retained and runs off downwards by gravity. If material manufacturers provide this data, the water content of these layers can be output separately in DELPHIN and compared with the critical values in PostProc 2.
2.2.4. Mold on the interior surface - DIN 4108-3 (draft) D.7.6
Currently, the German standard only contains the provisions of DIN 4108-2 on minimum thermal insulation. Here it is only checked whether the surface air humidity is greater than 80%. If this is the case, there is a risk of mold growth. However, this model is aimed at stationary considerations and can only be used to a limited extent for hygrothermal calculations. Application of this criterion is very far on the safe side here. The current draft of DIN 4108-3 contains further evaluation options. Here too, reference is made to the comparison with 80% relative humidity as a basic test. If this value is exceeded, a dynamic mold prediction model can be used. Such a model is described, for example, in the forthcoming WTA Code of Practice 6.3. It is known as an isopleth model. The evaluation in DELPHIN is similar to the wood destruction model:
-
Define outputs for temperature and relative humidity at the surface (boundary element) (spatial mean values in 2D)
-
Evaluation in PostProc 2 using the model (PostProc 2)
-
Further evaluation with the VTT model is possible
-
2.2.5. Algae on the outer surface
Algae growth on the exterior surface is a frequently occurring problem, especially in well-insulated buildings (thermal insulation composite systems). Unfortunately, there is still no standardized evaluation criterion for this. The decisive factor for algae growth is a high moisture content on the exterior surface. The temperature plays a subordinate role. It only has to be above 0°C.
An experimental algae growth model exists in PostProc 2, which was developed by an Italian working group. As with mold and wood decay, this model requires temperature and relative humidity as outputs. You can find out more about this here: 'Algae in PostProc 2'.
2.2.6. Corrosion
Corrosion generally refers to the destruction of materials through chemical processes. In the construction industry, this mainly applies to unprotected metals (structural steel) and concrete. Here, too, there are no standardized models. Models are currently being developed. When these are available, they will be made available in DELPHIN or PostProc 2.
3. Evaluations with DELPHIN 6.1
3.1. Example construction 1D
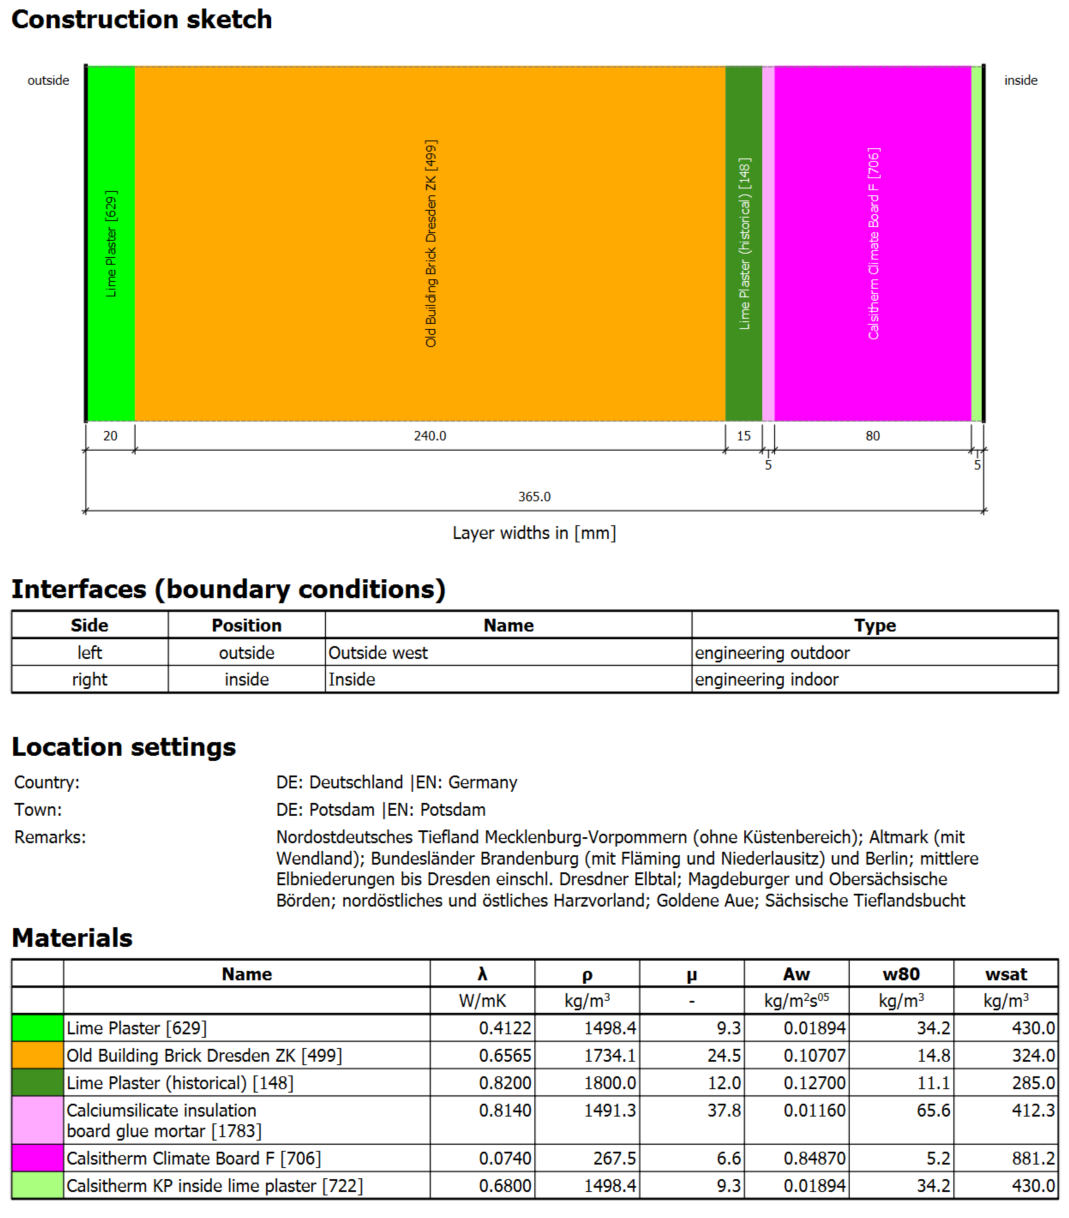
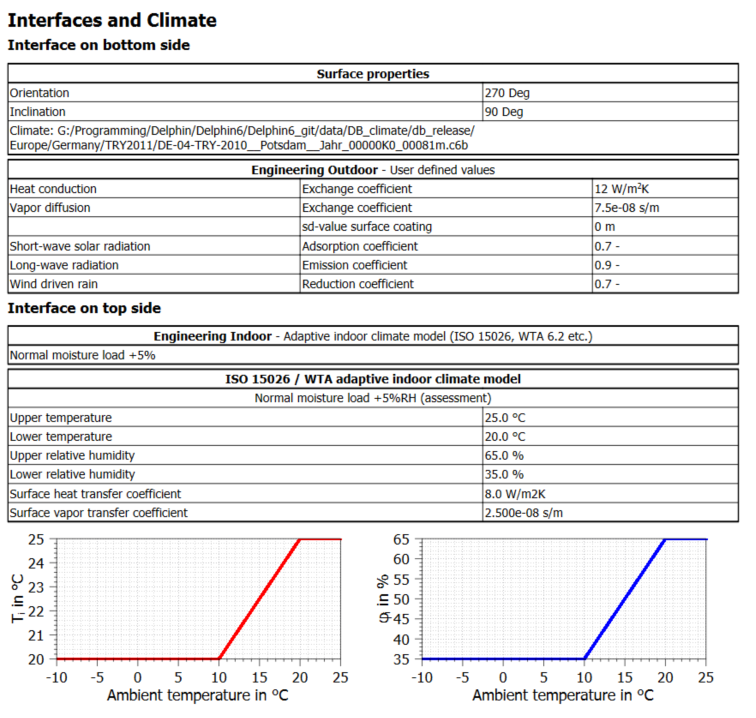
An internally insulated brick wall in 1D was chosen to illustrate the assessment options (except for mold) in DELPHIN. The following figures show the properties of this construction in the form of excerpts from the input data report. A different construction was chosen for the mold assessment because there is no risk of mold if the interior insulation is correctly installed.
3.2. Automatic evaluation in DELPHIN 6.1.6
Since version 6.1.5 of DELPHIN there is already a first variant of an automatic evaluation. This has the following properties in the current version 6.1.6:
-
only for 1D constructions
-
evaluates transient and frost damage in the construction as well as mold on the inner surface
-
automatically generates the necessary outputs and assigns them to the construction
-
Evaluation in a printable report
The evaluation can be activated in two ways:
-
Project creation wizard
-
Settings dialog
The evaluation for existing projects can be activated in the settings dialog. The dialog can be found in the main menu under Report (see images below).
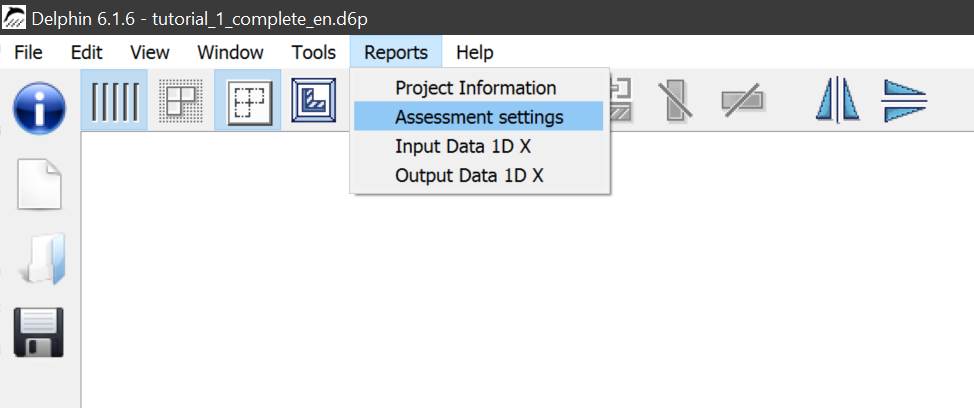
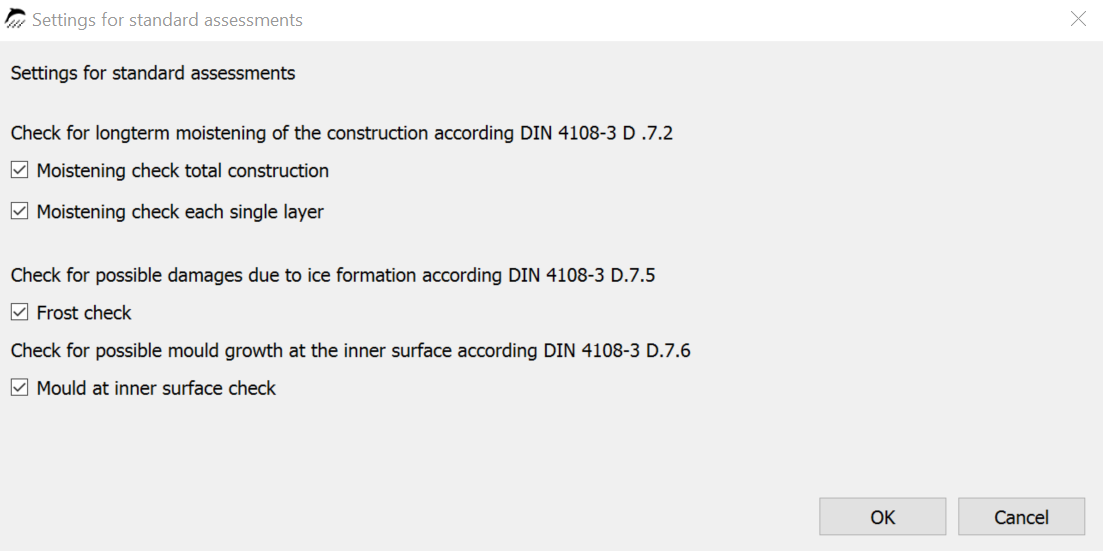
In the dialog itself, the assessment can currently only be activated or deactivated. Further settings will be added in later versions.
If the assessments have been activated for an existing project, the project must then be fully calculated again so that the data is available for the results report.
The project creation wizard is used when new projects are to be created. A more detailed explanation can be found here: Tutorial 1. The dialog for the evaluation settings comes at the end of the wizard. Here too, the evaluation can only be activated. This dialog is only active for 1D constructions.
Once the simulation is complete, you can view the results in the output report. This can be called up via the main menu - Report.
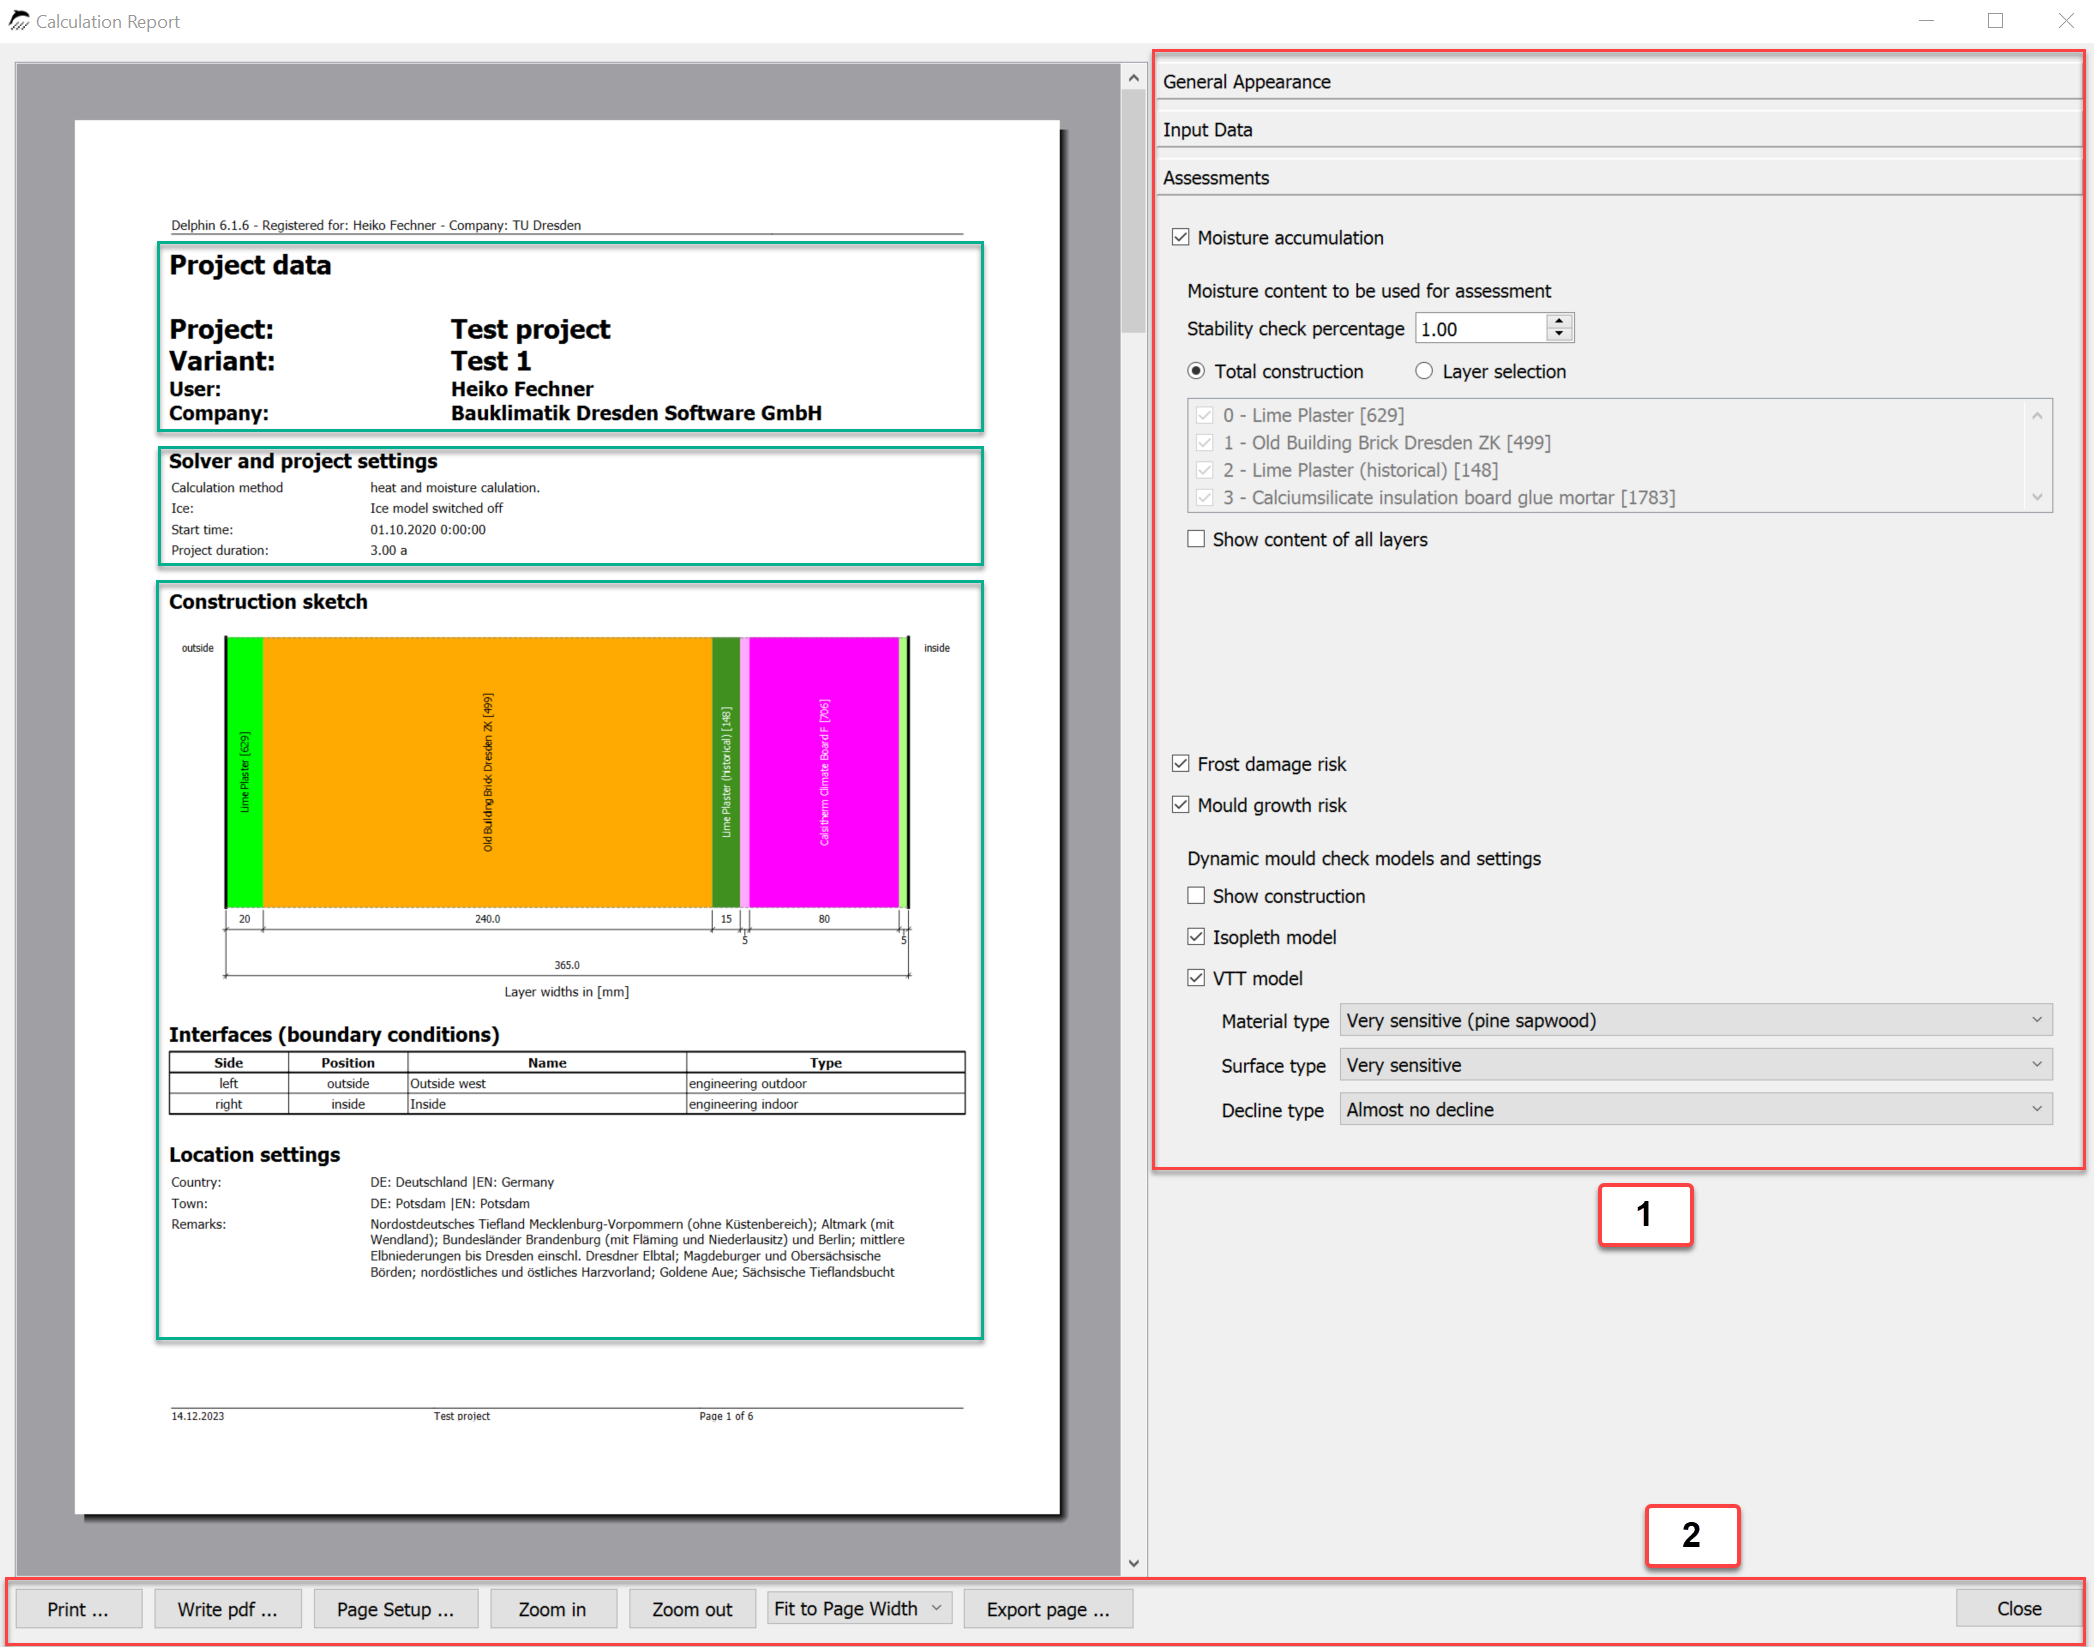
The following image shows the preview dialog with the first page of the output report.

All areas outlined in green represent input data in compressed form. A complete representation of the input data can be found in the input report. The outputs and evaluations appear on the following pages. The report can be configured in area 1 with a red border. The report can be exported and resized in the red area 2.
After the input data are the available evaluations.
3.2.1. Moisture accumulation
There are several setting options for moisture accumulation. The following image shows the settings dialog.
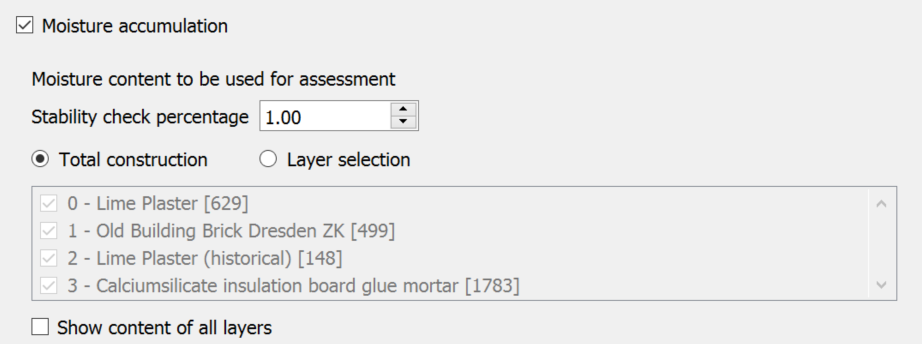
The evaluation can be deactivated in the top item. This is followed by a field for setting the change limit for the detection of stable behavior. The default setting here is 1%.
In the following, you can select which data is used for the evaluation. The following options are available:
-
Entire construction - moisture content of the entire construction
-
Layer selection - the component layers to be used for evaluation can be selected
The second option is required if highly water-bearing layers, such as the substrate of a green roof, are to be excluded from the evaluation. If this item is selected, a selection list for the layers becomes active.
The item 'Show moisture content of all layers' enables the graphical representation of the moisture behavior of each individual material layer.
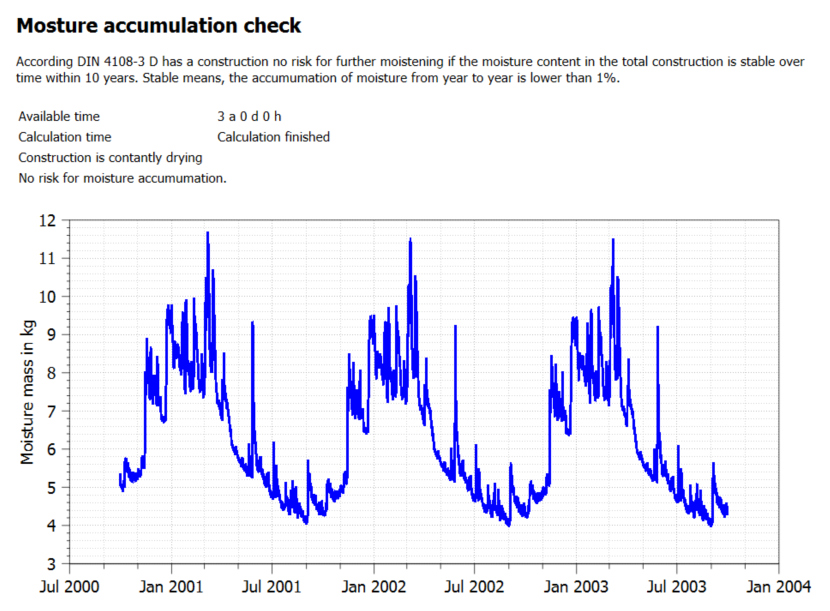
The figure above shows an example of this evaluation. First there is a short description of the test. This is followed by the time for which calculation results are available and whether the calculation has already been completed. Then a check is made to see whether the steady state has been reached and, if so, when this was the case. If this state has not yet been reached, the system checks whether the maximum test time of 10 years has already been exhausted. If yes, the criterion is not fulfilled. If not, it is pointed out that the calculation time should be increased to 10 years. The moisture content of the entire construction or all individual layers is then displayed graphically.
3.2.2. Frost damage risk
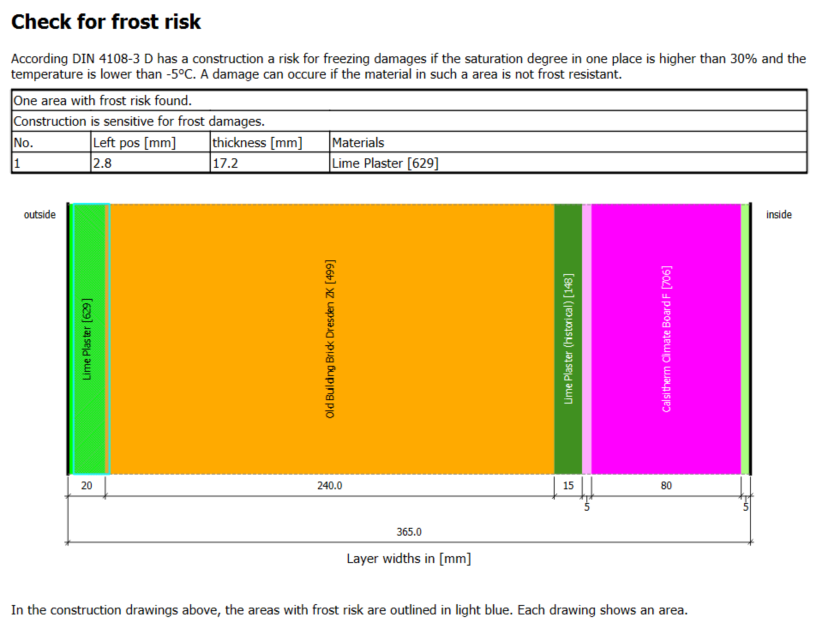
Here, too, a brief description of the evaluation criteria is provided first. This is followed by the output of the evaluation. If the criterion was not met (no risk of frost damage), this is described and no further evaluation takes place. Otherwise, a table with all areas with a possible risk of frost damage follows first. The columns of this table contain:
-
Number
-
Distance of the start of the area from the left (usually outside)
-
Thickness of the area
-
List of the materials located there
Below this, the construction is shown schematically. The areas found are marked with a light blue rectangle (green arrow). The user must ultimately decide whether there is a real risk of frost damage. It must be checked whether the materials in the area are frost-sensitive. Manufacturer data sheets or other literature can be helpful here. If several areas are found, a separate construction diagram is displayed for each area with the area marked.
3.2.3. Mold assessment on the interior surface
This automatic evaluation has been possible since DELPHIN 6.1.6. The evaluation requires the following:
-
1D construction (in x or y direction)
-
Exactly one external and one internal boundary condition
-
the simplified model must be selected for the surfaces (boundary conditions).
If all this applies and the mold evaluation is activated in the settings, the outputs for temperature and relative humidity are generated and assigned automatically. The evaluation is always carried out for the last year of the simulation.
The evaluation is carried out in two steps:
-
Evaluation according to DIN 4108-2 by testing for exceeding 80% relative humidity
-
Evaluation using a dynamic forecast model in accordance with WTA 6.3 (new version from 2023)
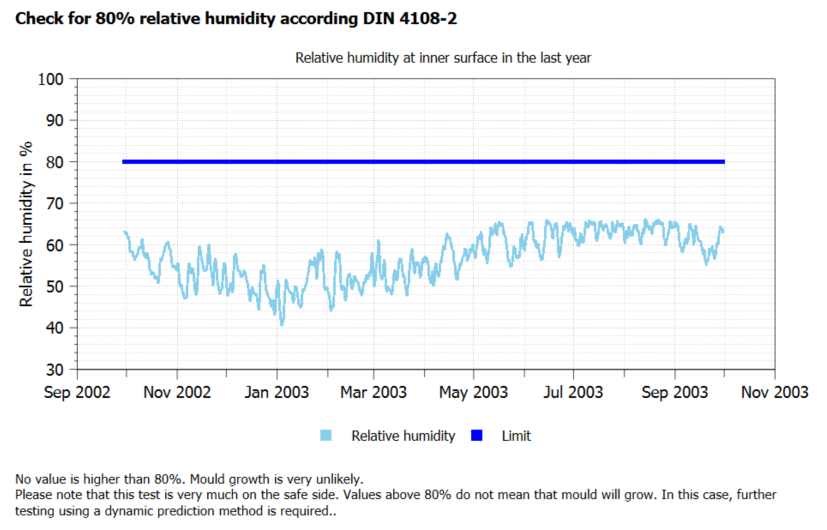
This test is very far on the safe side. If all values are below 80%, mold growth is virtually impossible. The picture above shows a clear exceeding of the 80% limit. In such a case, further evaluation should be carried out using a dynamic mold prognosis model.
Two different dynamic forecasting methods are described:
-
Isopleth model
-
VTT model
The isopleth model uses lines of equal growth in a diagram which shows the temperature on the x-axis and the relative humidity on the y-axis. The states on the surface of the construction are then represented as points. There are different types of isopleths:
-
Differentiation according to nutrient supply on the surface - here high nutrient supply (heavily soiled surface) fixed
-
Limit for germination (LIM construction) - no growth or germination below this line
-
Time-dependent germination lines
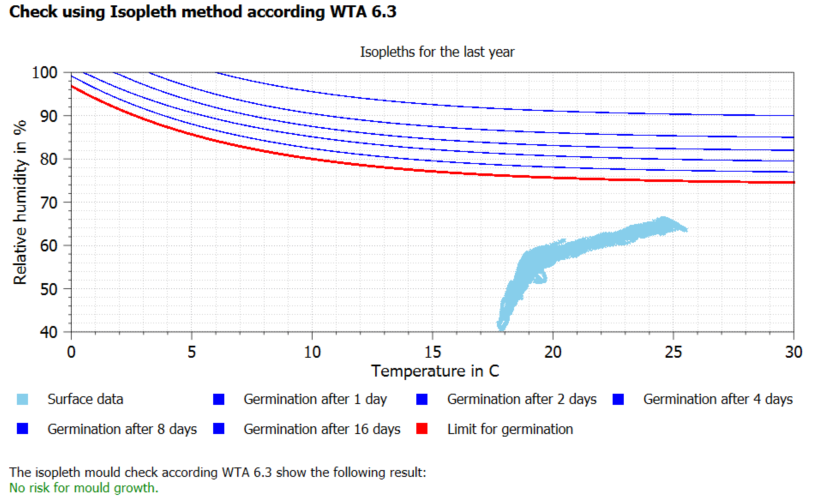
The model now checks how long the individual boundary lines are crossed. If the total time of exceedance reaches the limit value of the respective line, there is a high risk of mold growth. There are no further setting options in this model.
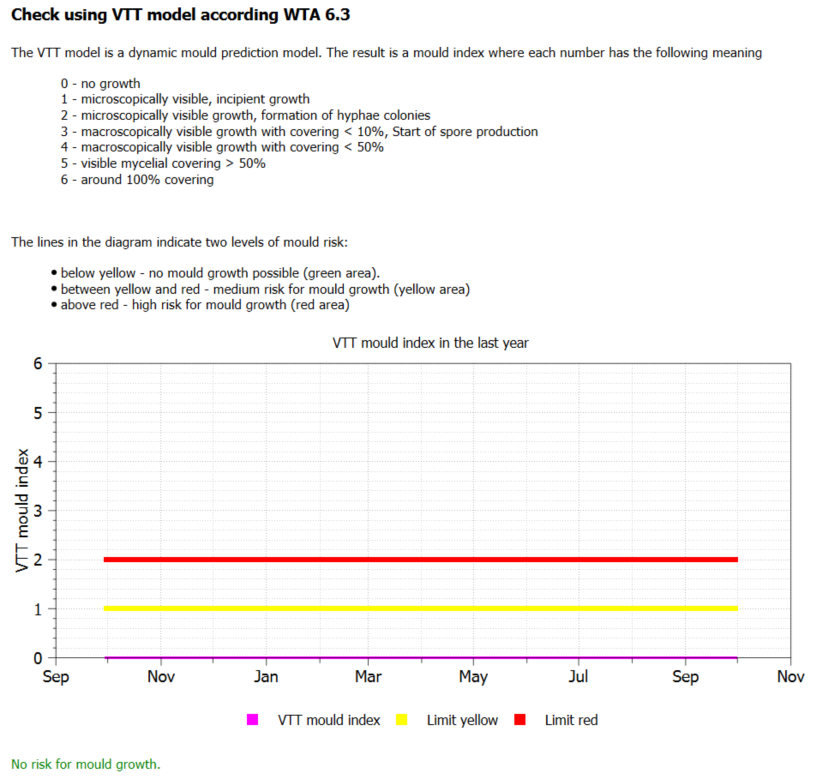
The VTT model calculates a mold index. An explanation of the meaning can be found in the image below:
This model can be configured using three different options (see also the settings dialog in the image below):
-
Material type
-
Very sensitive - Pine, rough sawn
-
Sensitive - spruce, wood panels
-
Medium resistant - concrete, mineral wool
-
Resistant - EPS
-
-
Surface type
-
Very sensitive
-
Sensitive
-
Medium resistant
-
Resistant
-
-
Regression type
-
Rapid regression - jaw
-
Significant relevant regression
-
Relatively slight regression
-
Almost no regression
-
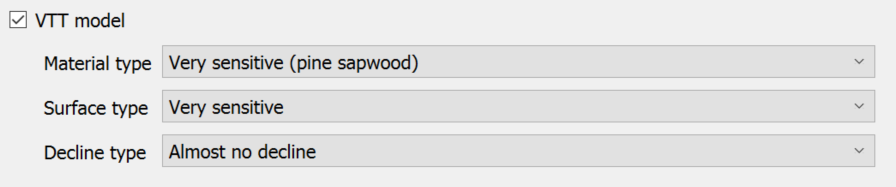
By default, these options are set to worst case (very sensitive, very sensitive, no regression). There are two lines in the diagram to help with the evaluation. The whole thing is modeled on a traffic light:
-
below the yellow line, the stage is green - everything is fine
-
between the yellow and the red line is stage yellow - attention, mold growth is possible
-
above the red line is red - mold is very likely
3.3. Manual evaluations
Assessments can also be carried out in combination with DELPHIN and PostProc 2. Here, more types of damage can be assessed and there is no longer a restriction to 1D constructions. The following procedure must be followed:
-
Determination of the possible types of damage
-
Creating and assigning the necessary outputs in DELPHIN
-
simulation
-
Evaluation in PostProc 2
-
Description of the evaluation in a word processor of your choice using diagrams from PostProc 2
3.3.1. Moisture accumulation
The output of the integral moisture mass is required to evaluate the moisture accumulation. This output is usually required for the entire construction. According to DIN 4108-3, however, highly water-bearing layers such as weather protection shells or green roofs should not be taken into account. In such cases, an output must be assigned that does not include these layers. Furthermore, it can also be useful to check individual material layers for their long-term moisture behavior (e.g. insulation layers). An output for the integral moisture mass should always be configured as follows.
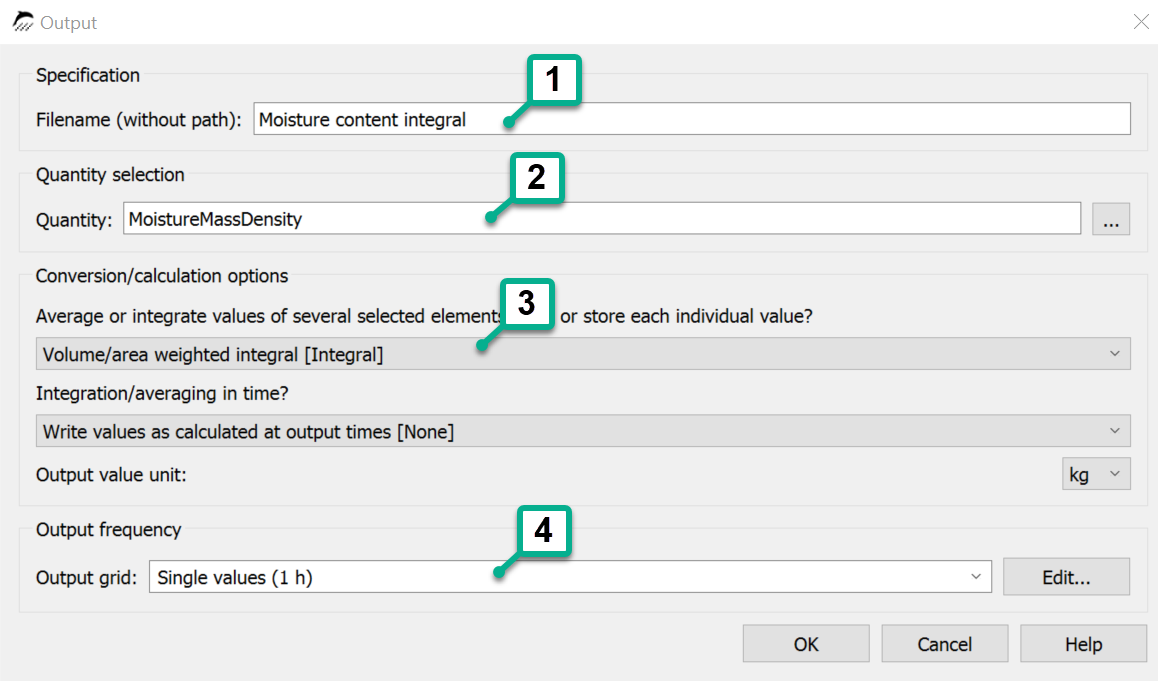
-
Name - should reflect the size and location of the mapping
-
Physical quantity - here always 'MoistureMassDensity'
-
Spatial format - here always 'Volume/area weighted integral', alos sum over all elements
-
Output grid - if possible always hourly values
After the simulation, this output can then be displayed and evaluated in PostProc 2.
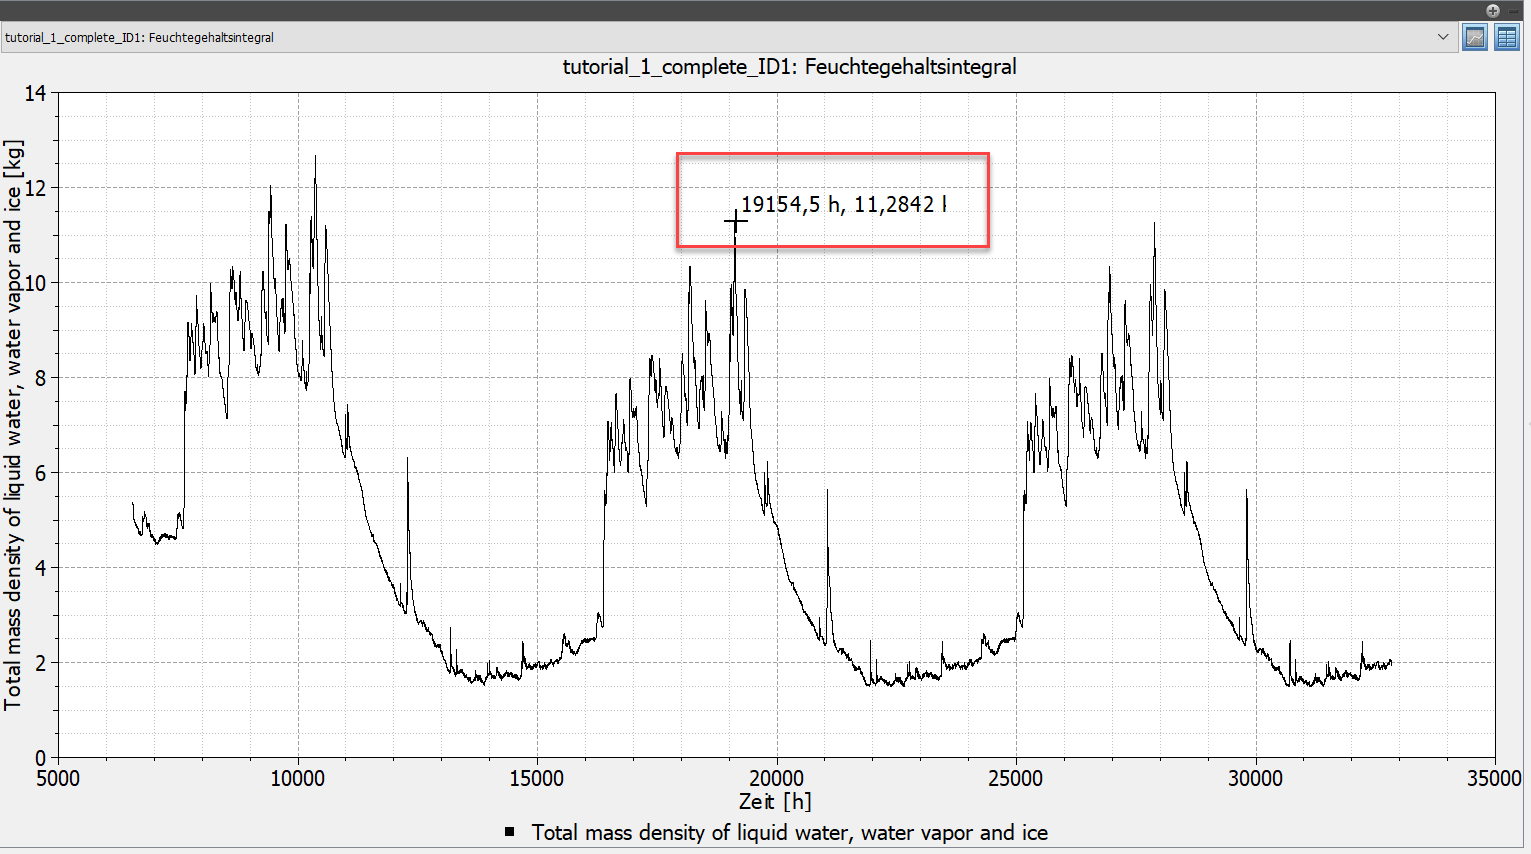
When the mouse cursor is positioned in the diagram, the x and y values are displayed next to it. This is a quick method to get the values at certain points. This makes it easy to compare the values from one year to the next to see if the change is less than 1%. In this case, however, this is not necessary because the moisture content is decreasing and therefore there is no risk of moisture accumulation anyway. A precise evaluation can be carried out by switching the view from diagram to table.
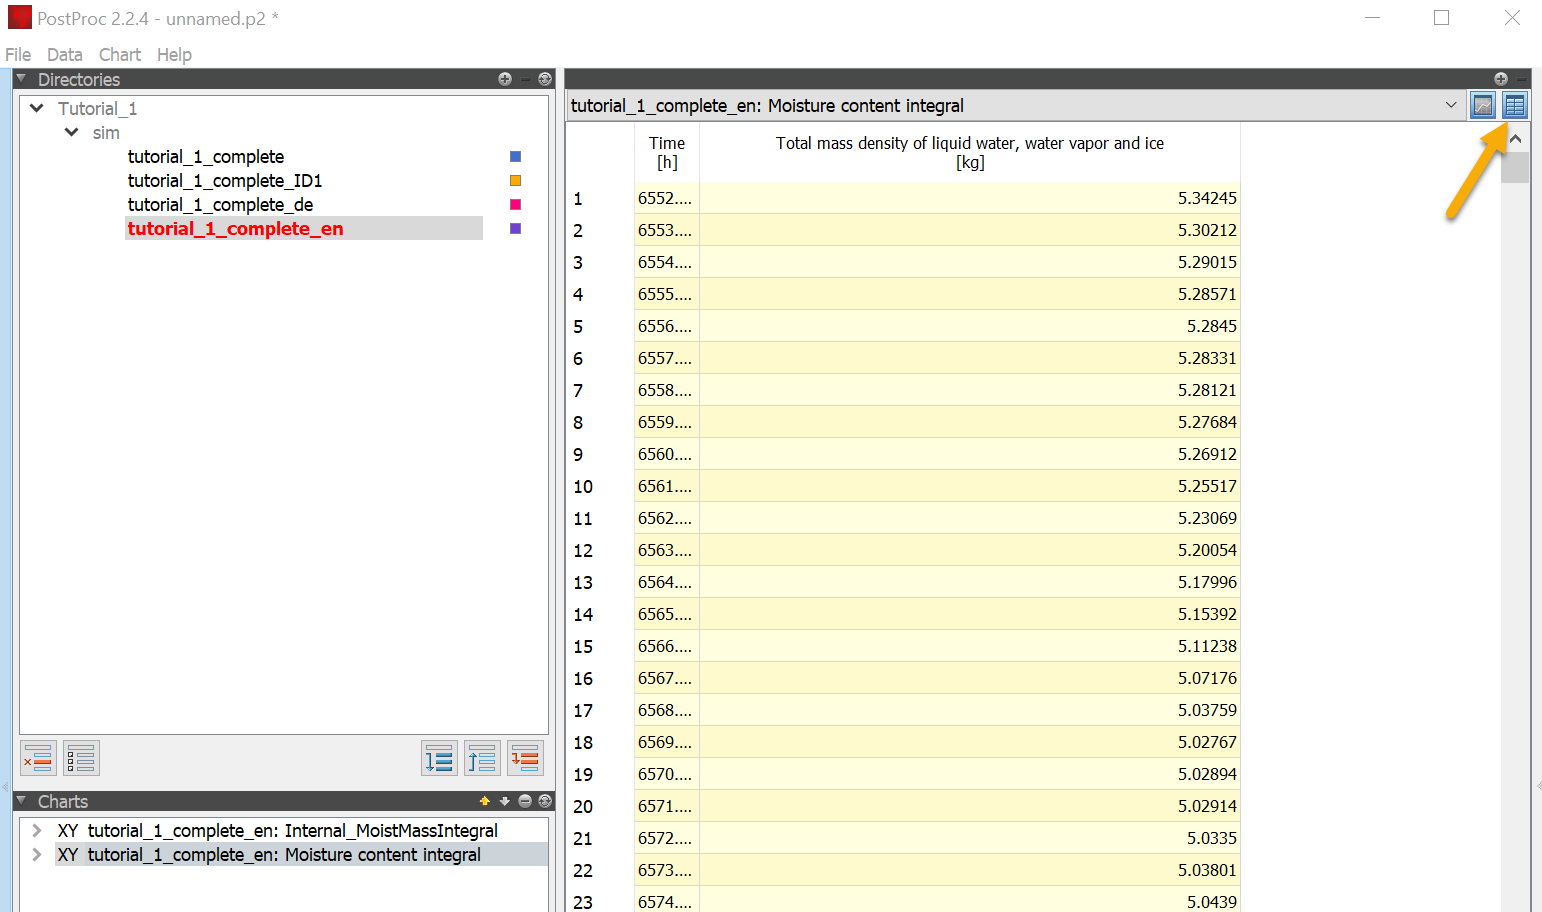
Here you can read and compare the exact values at any time.
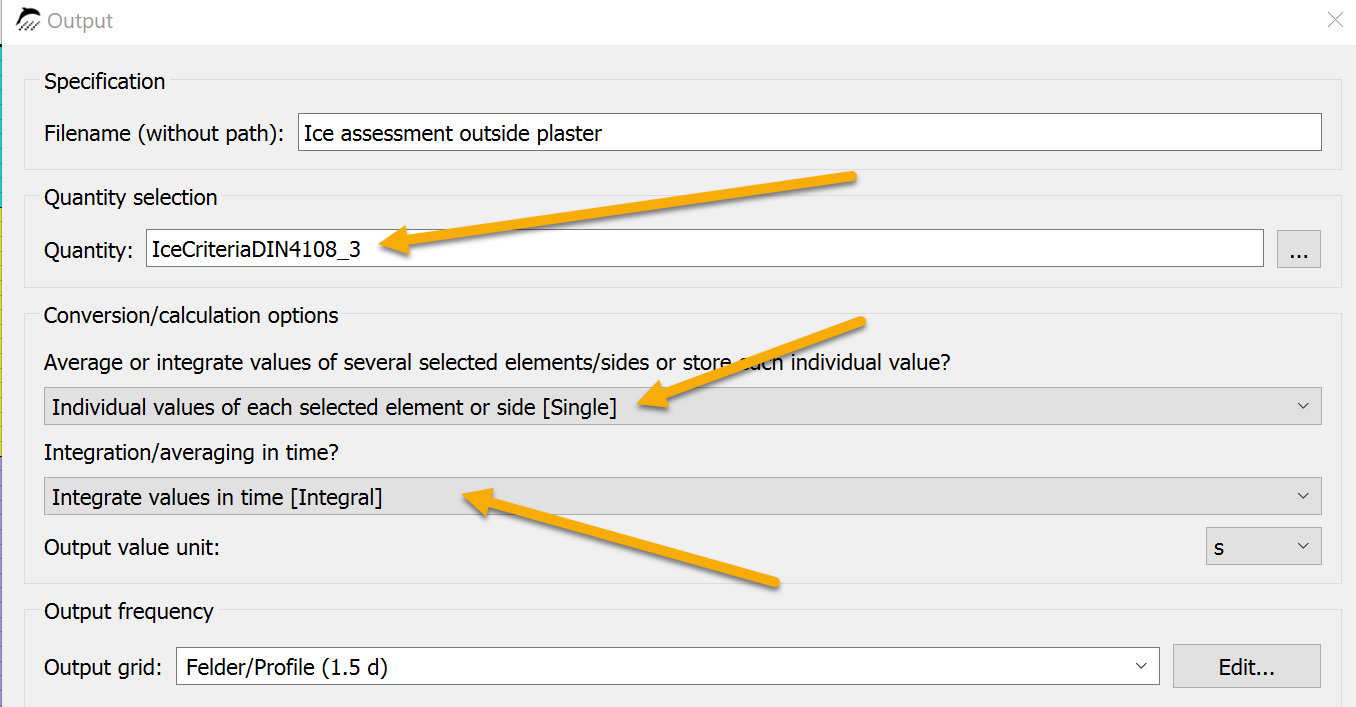
3.3.2. Risk of frost damage
There are various options for evaluating the risk of frost damage. The simplest is to generate an output of the type 'IceCriteriaDIN4108_3' and assign it to the entire construction. This output generates a value greater than 0 if the degree of saturation is greater than 30% and the temperature is less than -5°C. The exact value results from existing degree of saturation - 30%. The formatting should look like this:
In this case, you should select 'Individual values …' for the spatial format. This not only allows you to determine whether there is a frost risk, but also to determine the position. For the time, you should select 'Integrate values in time'. This causes the values to be accumulated over time. Then you can simply evaluate the profile for the last time of the simulation and see immediately whether the risk was greater than 0 at any time during the simulation. This also works for 2D constructions.
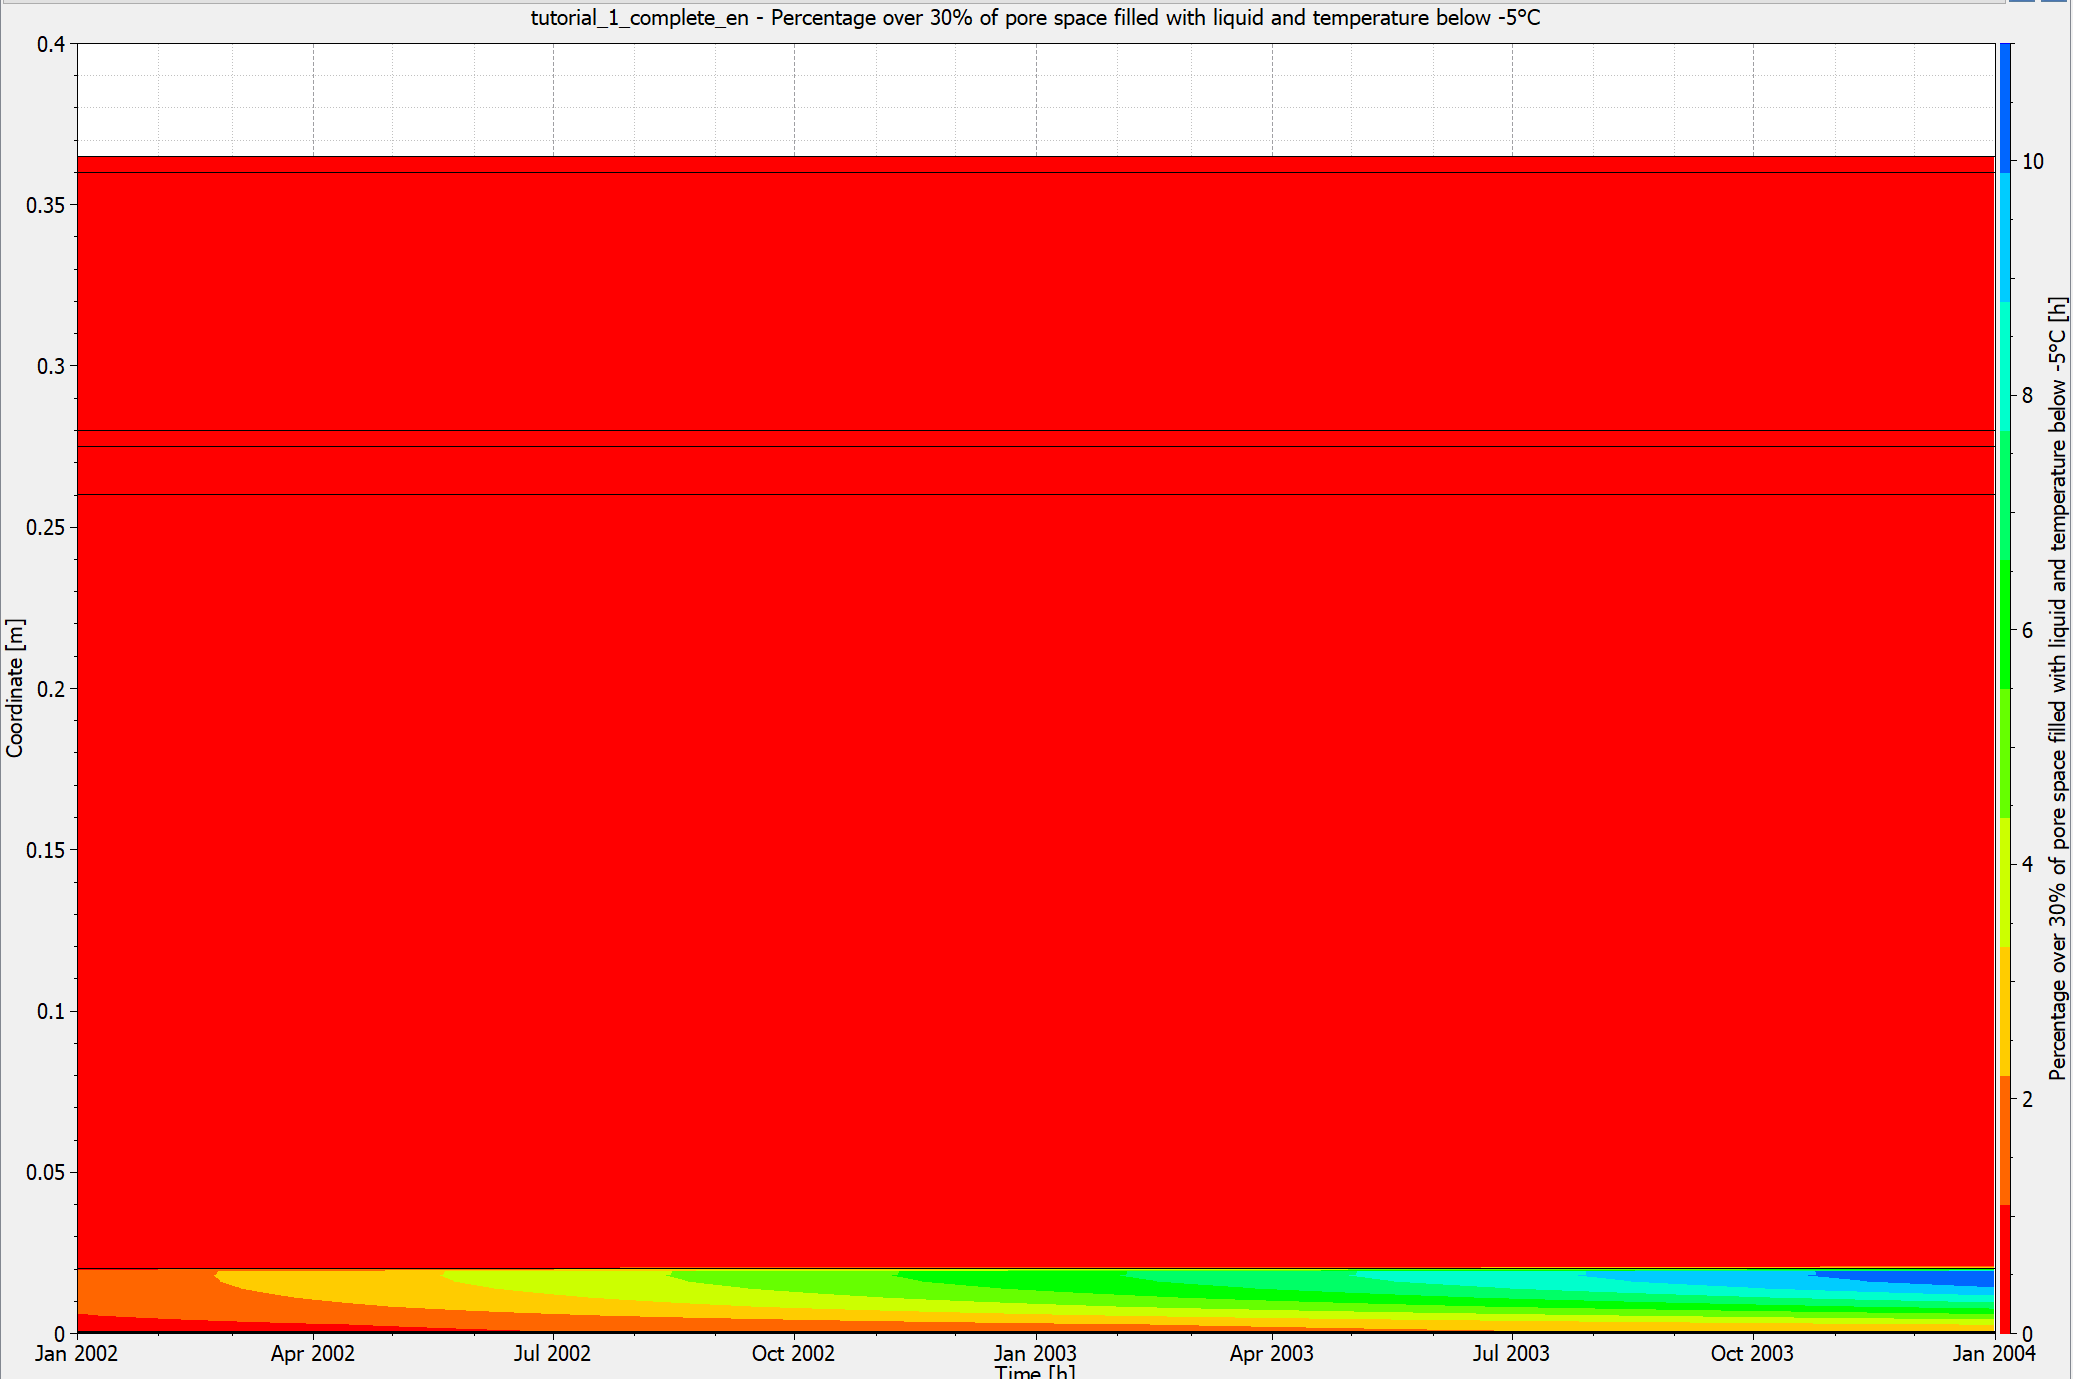
The image above shows the frost risk over location and time. The x-axis is the calculation time and the y-axis is the construction thickness. 0 on the y-axis (bottom) is outside. Red means 0, i.e. no frost risk. All other colors describe a risk greater than zero. As you can see, there is a zone with a risk of frost damage in the external plaster. Now you have to check whether the material of the exterior render is frost-resistant.
3.3.3. Mold growth on the interior surface
To assess the risk of mold, you need the temperature and relative humidity on the interior surface. These outputs are usually already available for 1D constructions and when using the project wizard. Otherwise, these outputs must be added. For 2D designs, you must define sensitive areas on the interior surface yourself. Several positions can also be possible here.
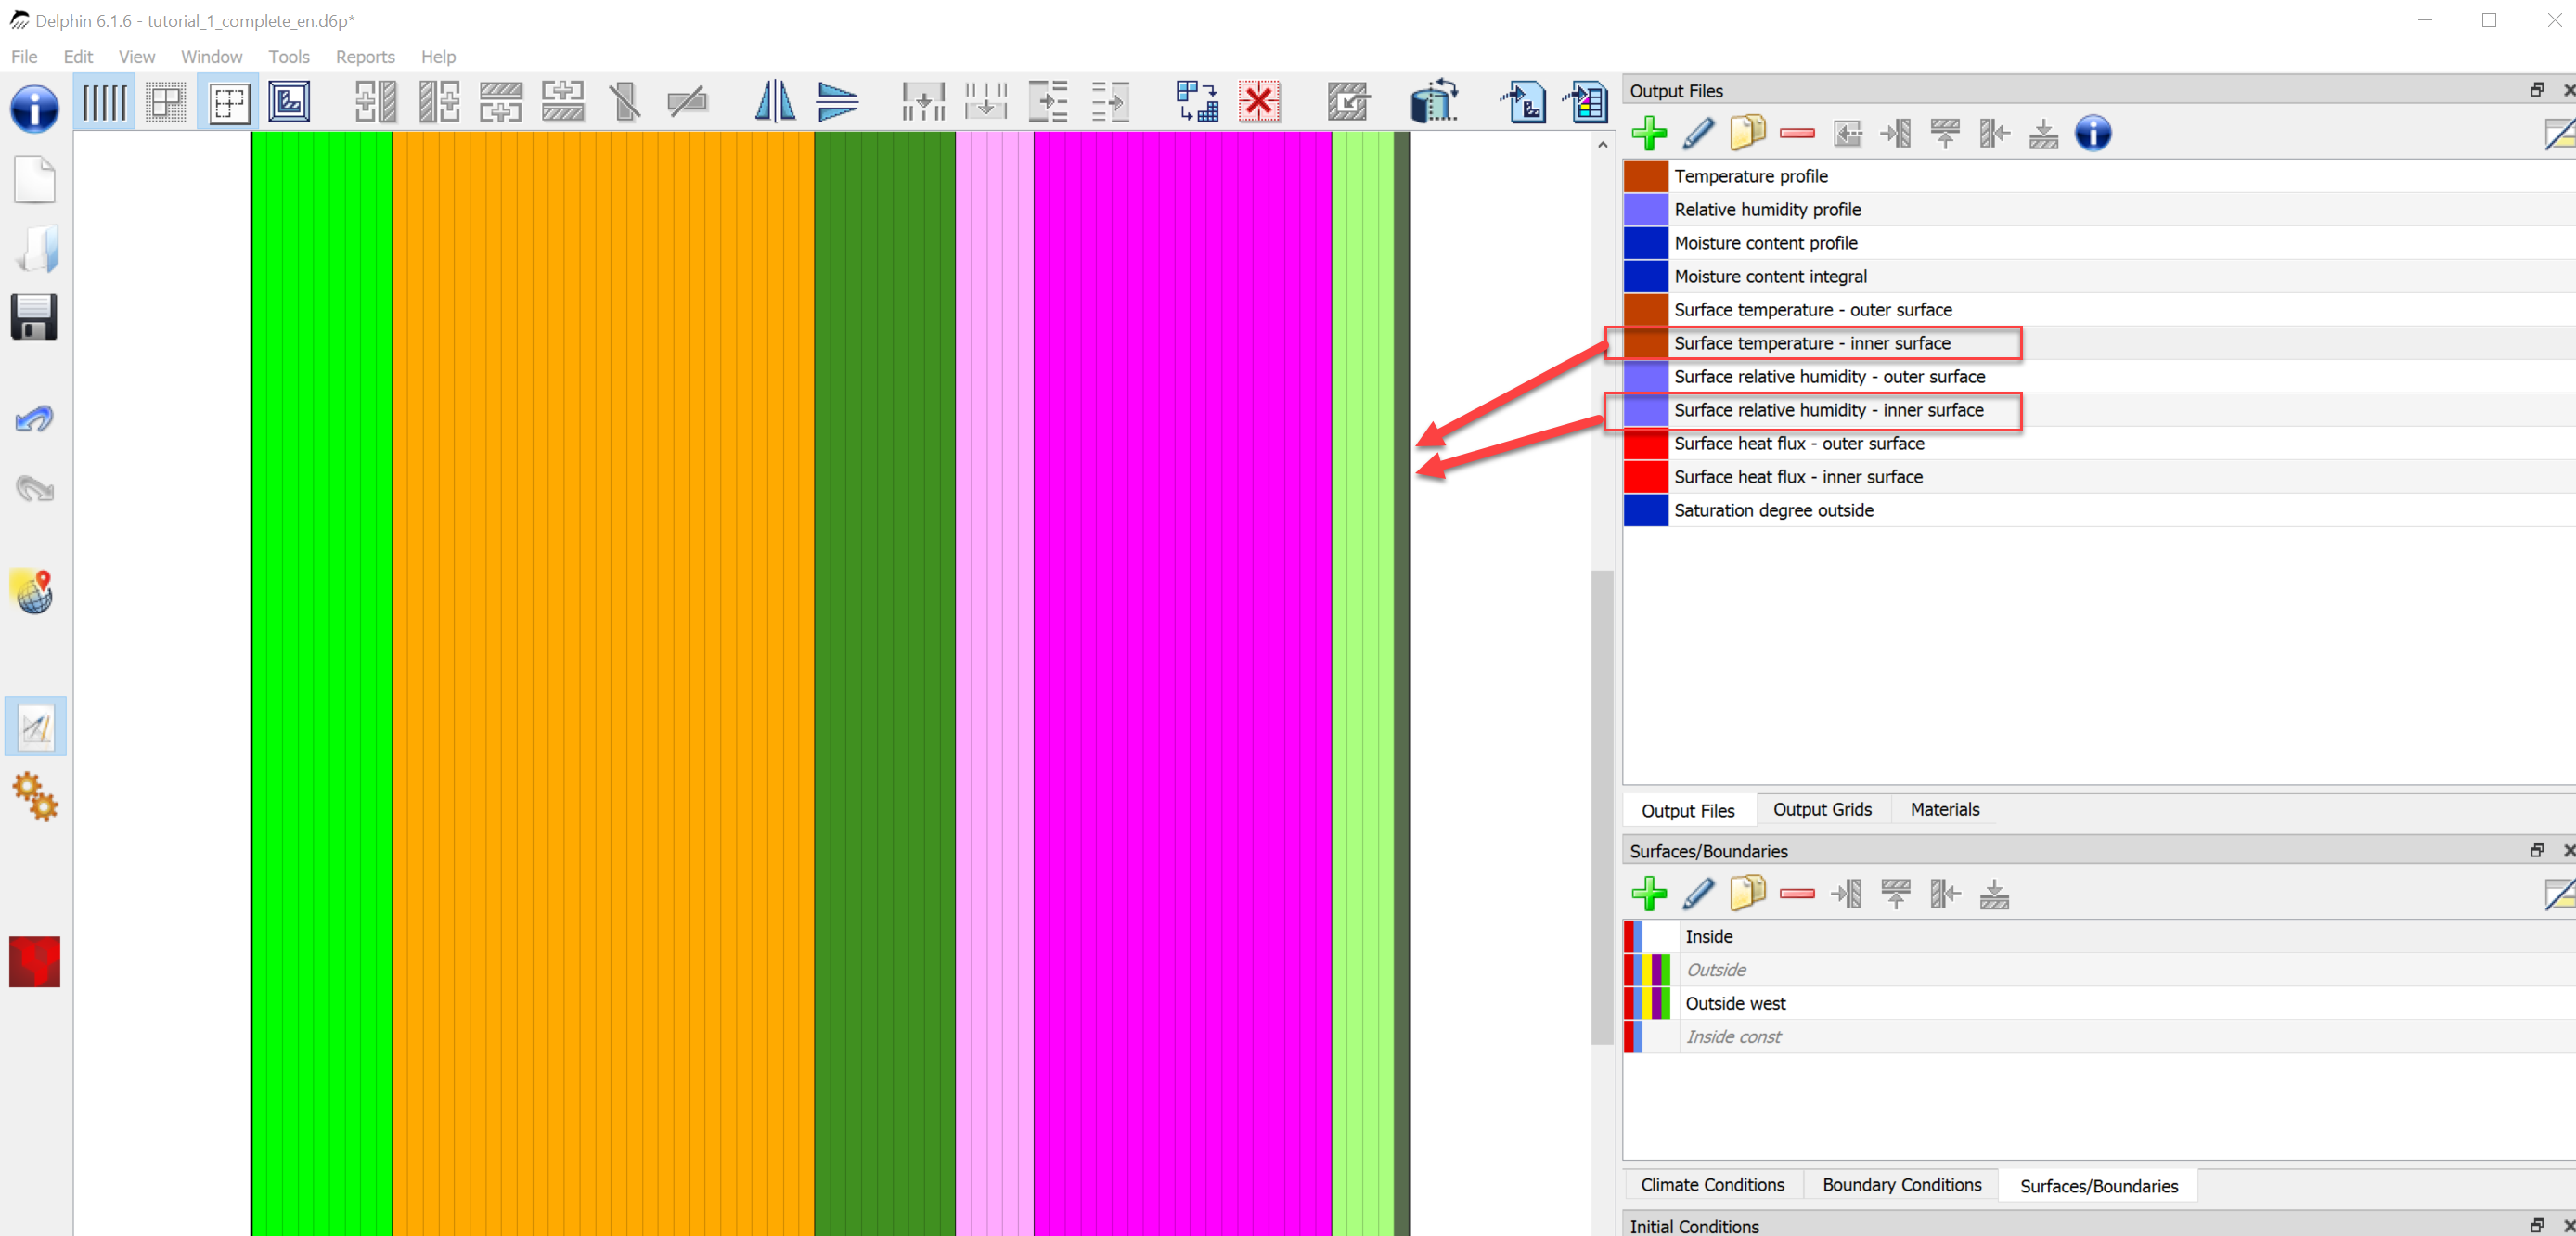
The image above shows the 1D construction with the two outputs mentioned and their assignment to the edge element on the inside. After the simulation has been completed, these outputs can now be evaluated in 3 ways:
-
Comparison of the relative humidity with the limit value of 80%
-
Use of the ispolethic model
-
Use of the VTT model (Viitanen)
In Germany, point 1 and then possibly point 2 are always checked. The Viitanen model (3.) is more common internationally.
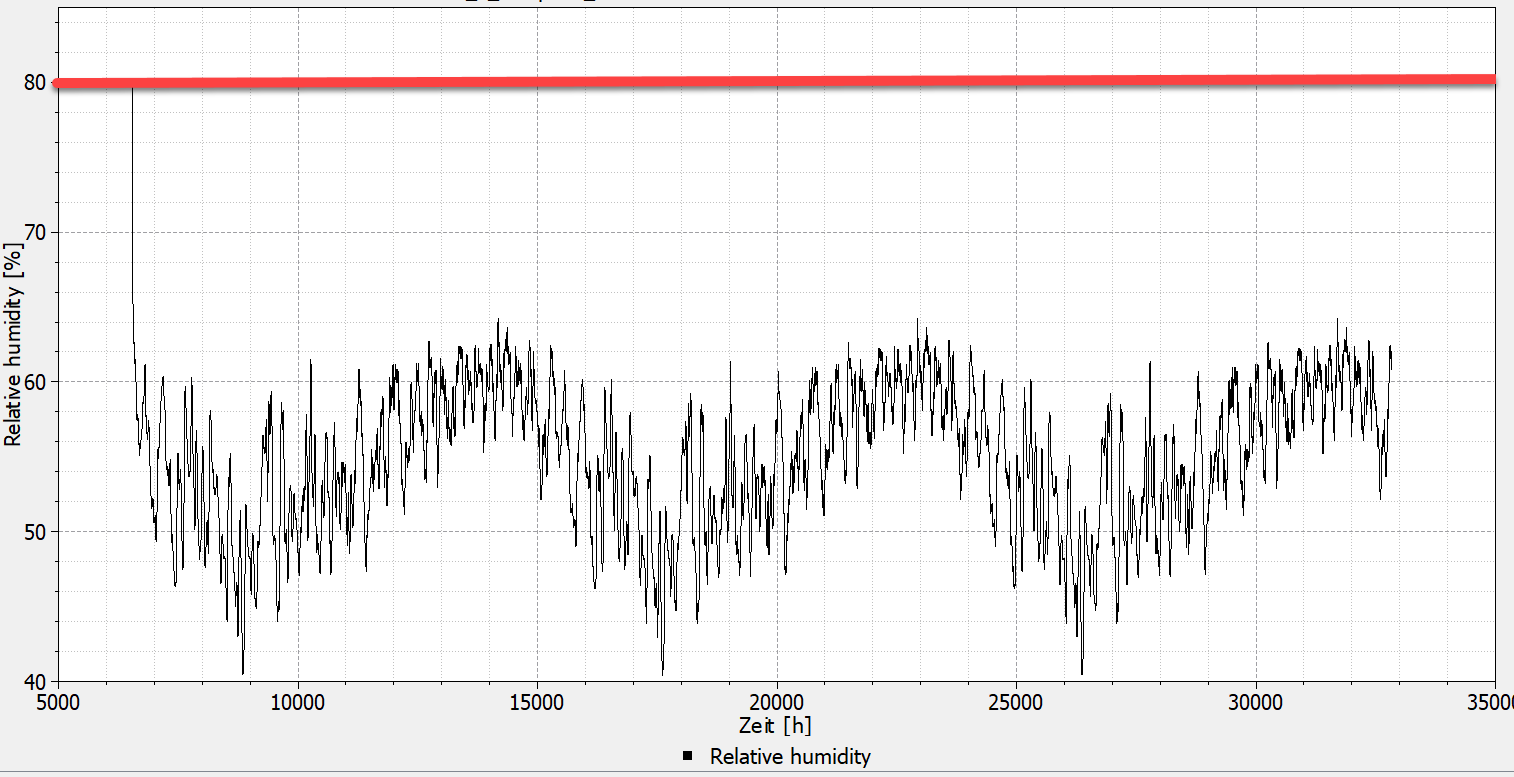
It is easy to see that in our case the surface air humidity remains constantly below 80%. There is therefore no risk of mold growth. However, this was to be expected with an insulated construction. No further evaluation is actually necessary now. For the sake of completeness, however, the test with the isopleth model is carried out. This model is also described in WTA Code of Practice 6.3. The creation of such a model output is described in the PostProc manual www.bauklimatik-dresden.de/postproc/help/de/index.html#_isoplethenmodell [here].
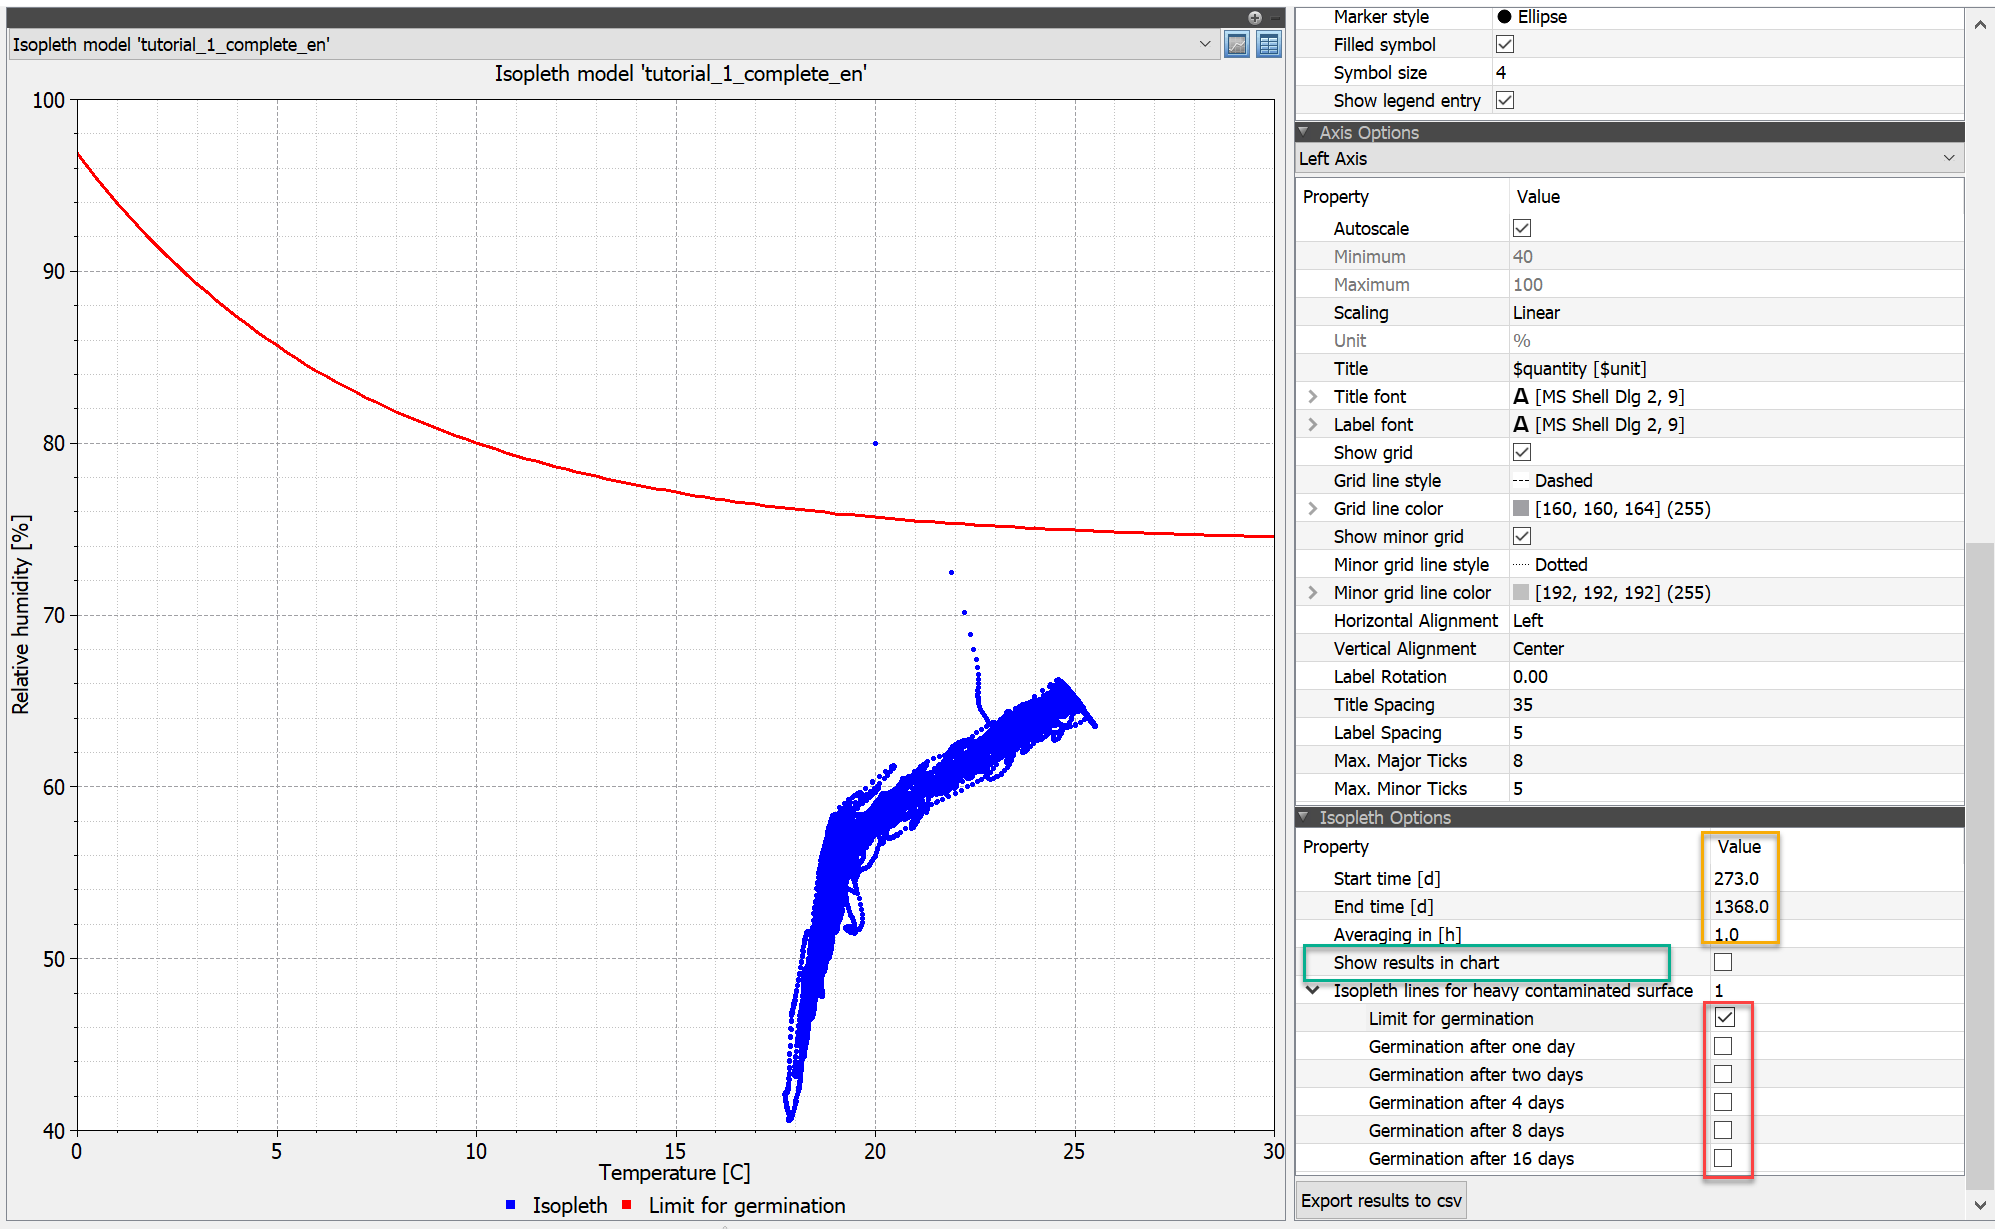
After the diagram has been created,
-
Select data for temperature and relative humidity (Ctrl-click)
-
Select model (at the bottom of the postproc)
-
Create diagram (click on the button on the right above the green plus)
you can display the isopleths you want to see in the model options (bottom right) (red rectangle). In the diagram shown, only the germination limit is shown. If all points are below this line, the mold risk is zero. The one point here in the diagram is the initial condition and must not be considered. For easier evaluation, it is advisable to show only the last year with daily averages (see image below, settings marked in red).
The entire procedure for mold evaluation can also be used for items in the construction. It should be noted here that the dynamic prediction models are validated for freely weathered surfaces. The informative value inside a structure is therefore limited. If at all, such an assessment should be carried out on the surfaces of air layers or cavities. The extent to which mold growth on the inside constitutes damage is also currently unclear.
3.3.4. Wood damage
An unventilated flat roof is chosen as an example to demonstrate the assessment of wood damage. The assessment should be carried out on a critical area in the wood. A distinction must be made between solid wood and wood-based materials. For solid wood, the test is carried out for a maximum moisture content of 20M% and in accordance with the wood destruction model according to WTA 6.8. In addition, the VTT (Viitanen) wood destruction model is also available, which is particularly well known among wood preservationists. For wood-based materials, only the test for the respective maximum moisture content in M% is carried out (see assessment of wood destruction). The graphic below shows the construction as a representation from the DELPHIN construction view.
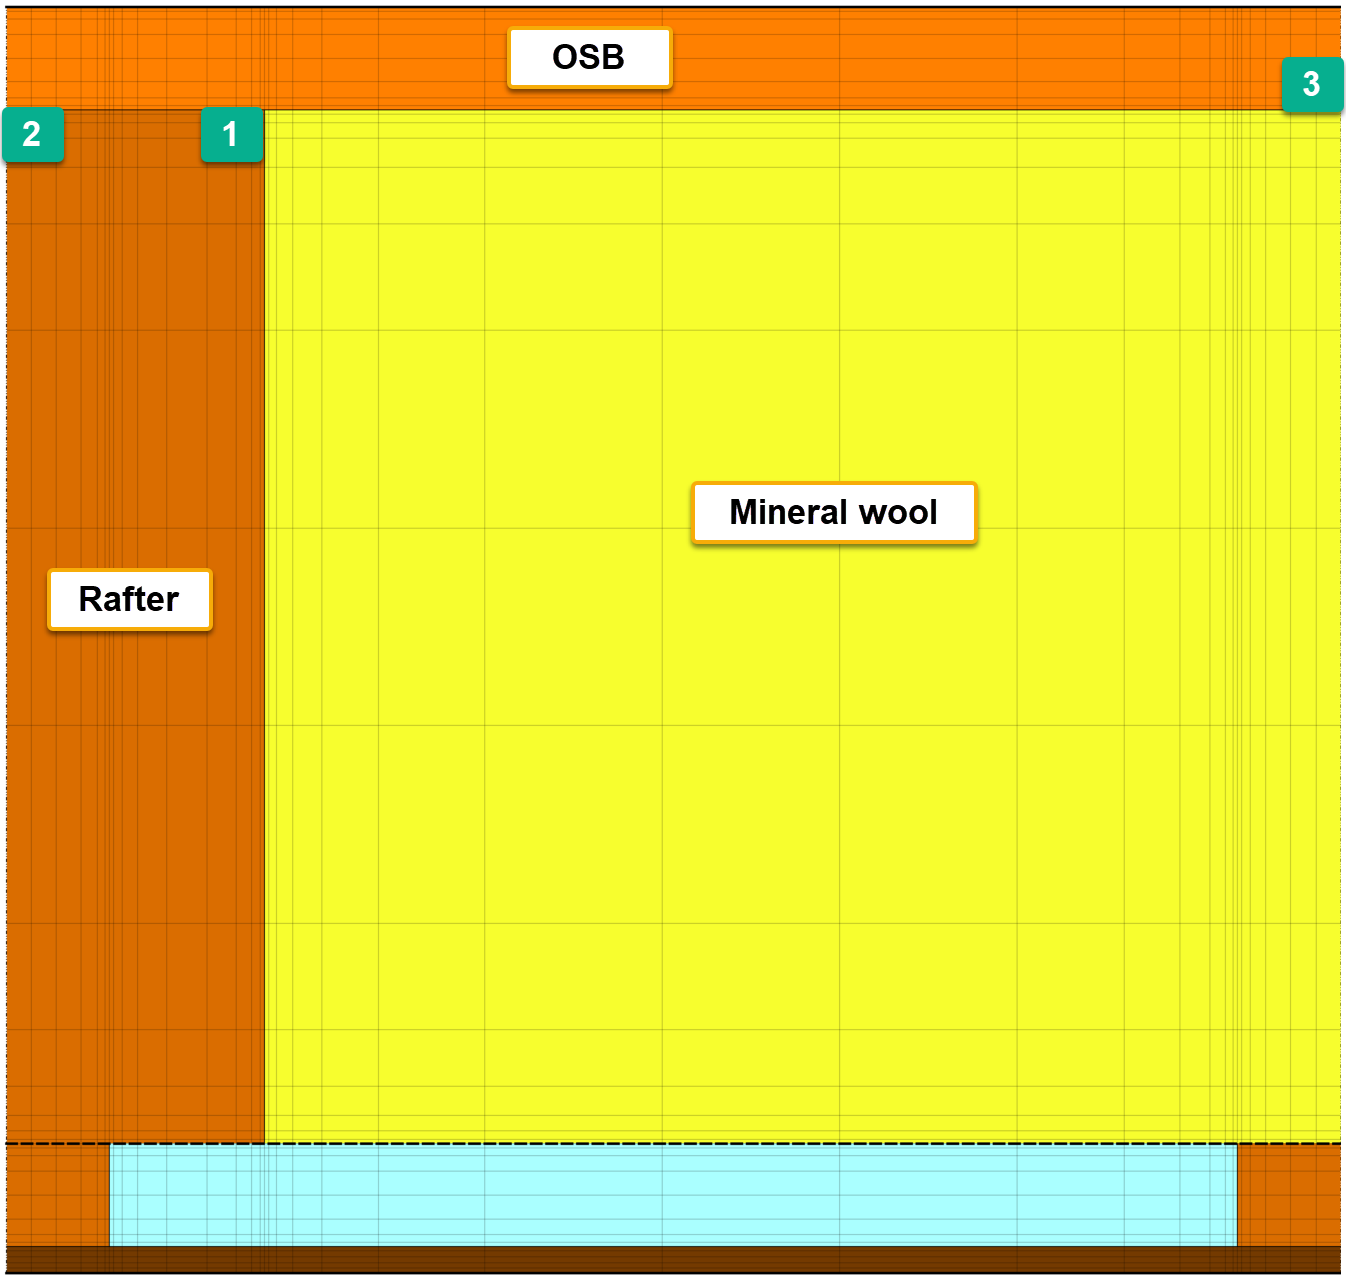
The two areas 1 and 2 were selected for the evaluation in the rafter. The following output was used there:
-
temperature - mean value
-
relative humidity - mean value
-
Moisture content in percent by mass - mean value
All outputs are in hourly intervals. Only one area (3) in the middle of the compartment on the underside was selected for the OSB board. Further outputs can be added here if required. All areas are approx. 1x1cm2 in size.
First, the wood moisture in the rafters is examined. This involves checking whether these exceed the value of 20M%. Exceeding this value is permissible in the first 3 months. The following diagram shows the wood moisture content in all 3 areas.
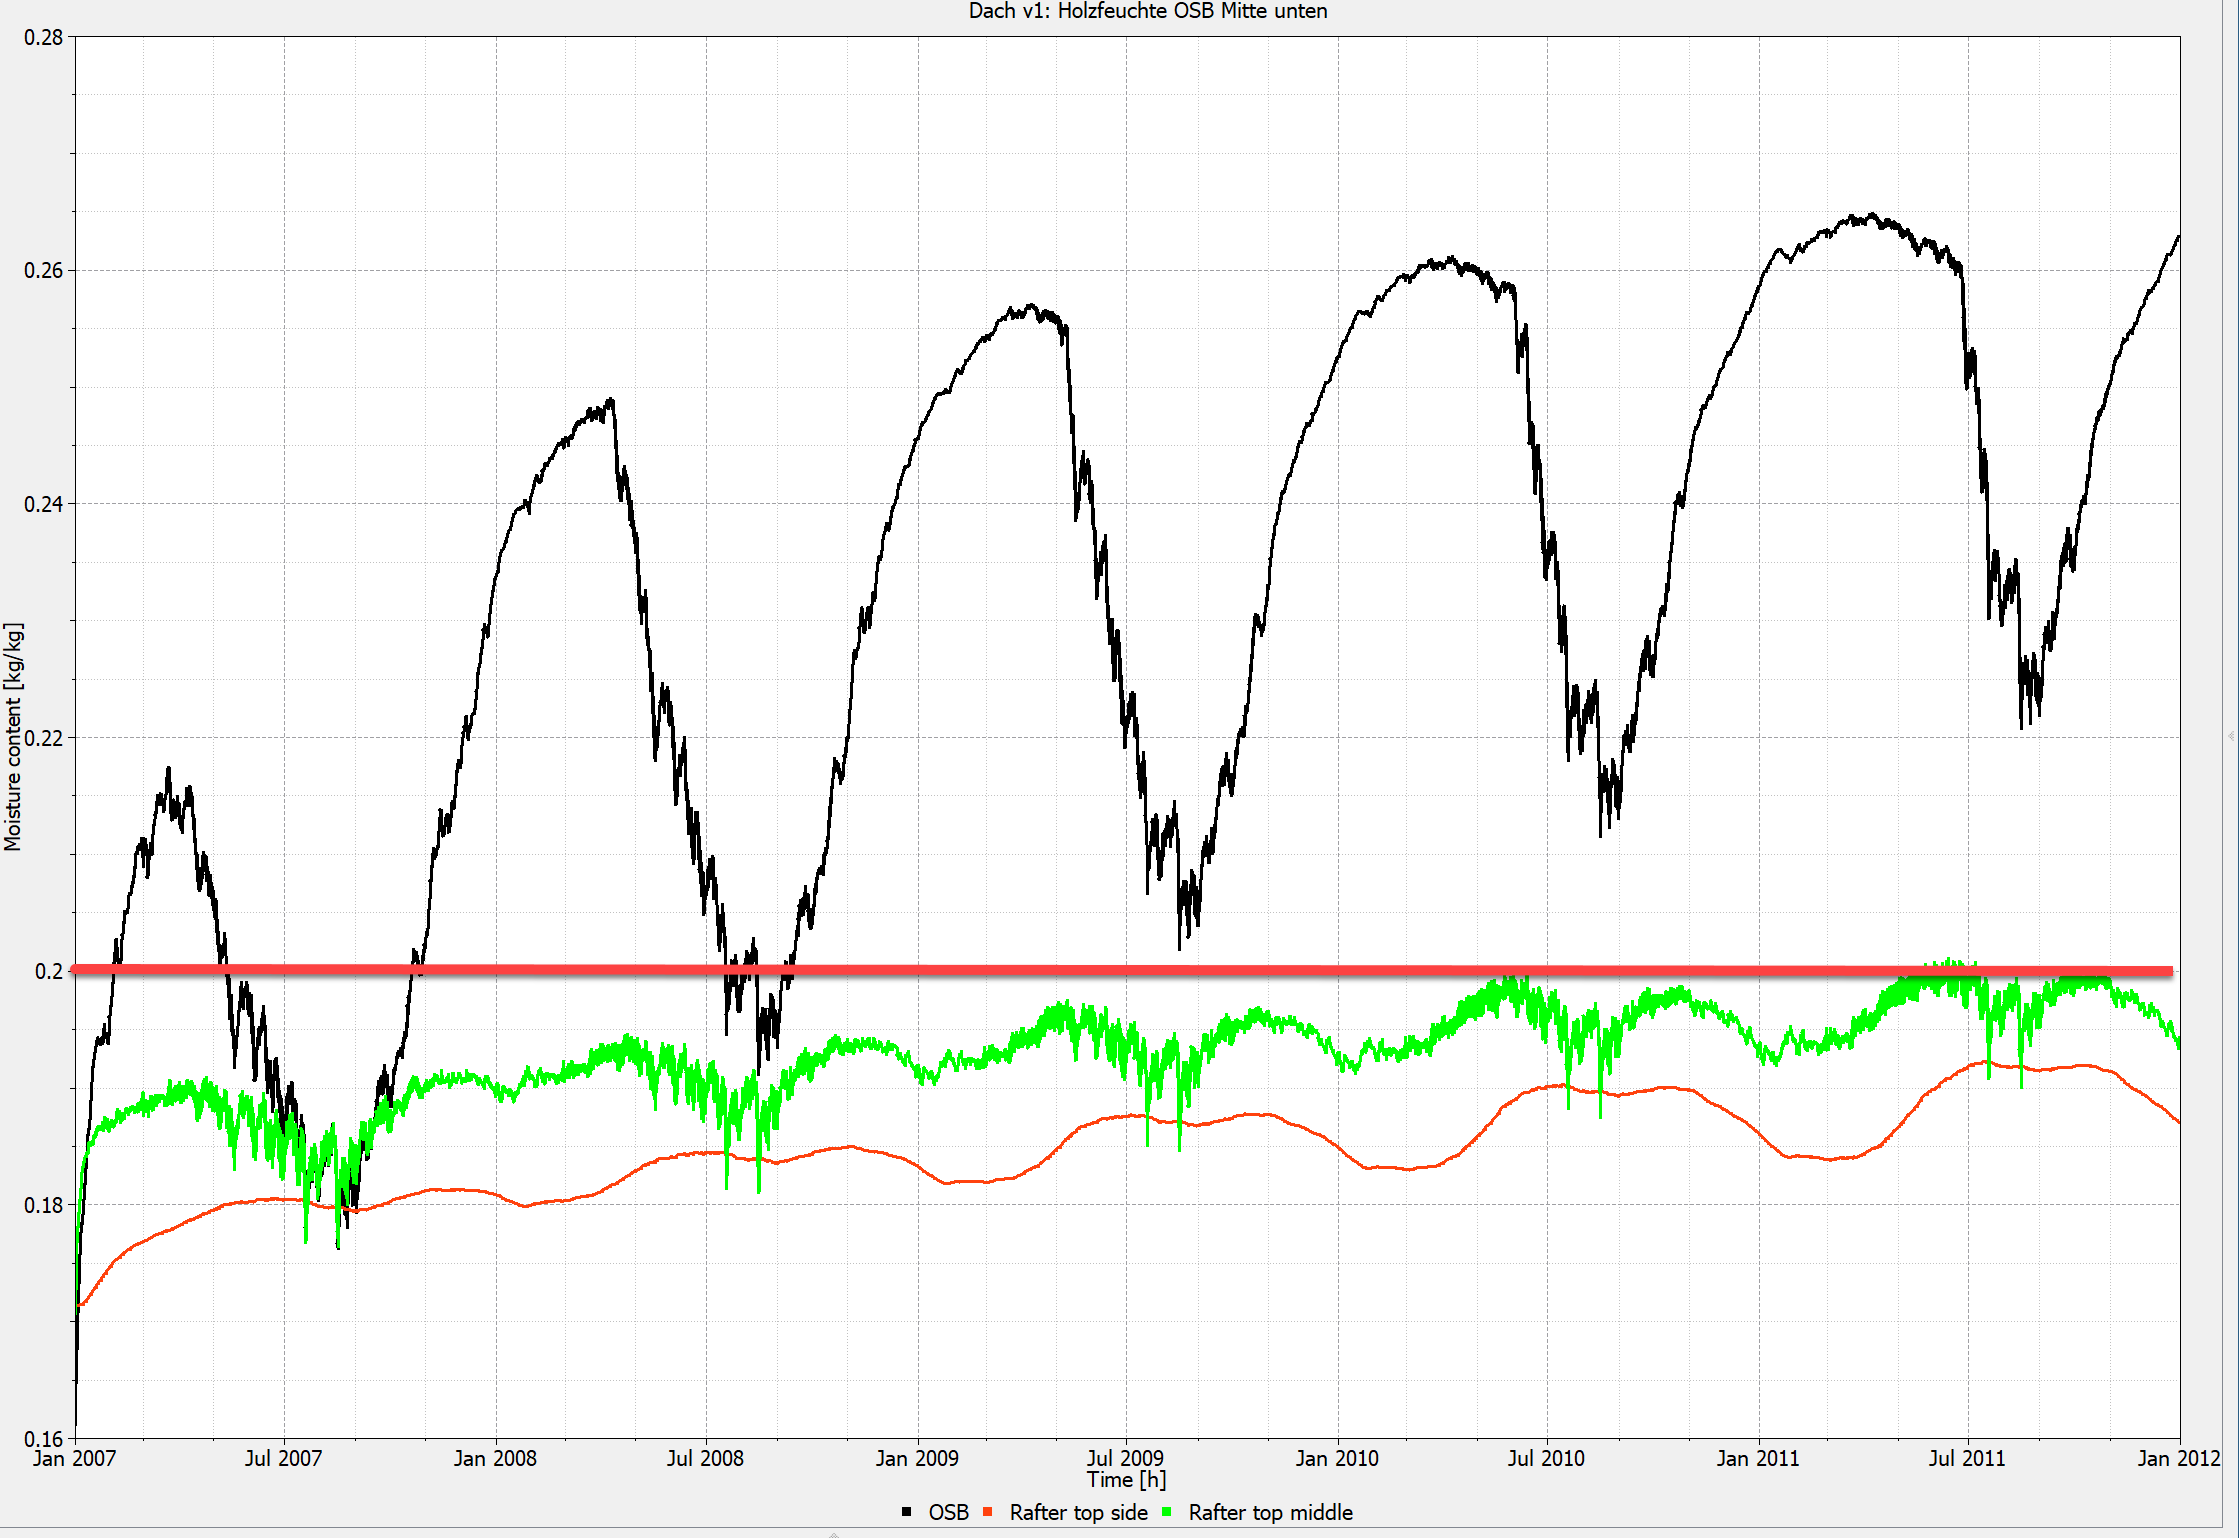
For the two wood moisture contents in the rafters, only position 1 (side to compartment) exceeds 20M% in the last calculation year. However, the moisture content continues to increase. This construction could therefore be classified as inadmissible. The moisture content of the OSB board even exceeds 26M%. However, there is no clear limit value here. If an OSB board were to be classified as a wood-based material that can be used in damp areas, the limit would be 21M% according to DIN 68800-2. However, such a classification is questionable. Experts agree that separate limit values must be created for OSB boards. Finally, area 1 is evaluated using the WTA wood destruction model. To do this, select the temperature and relative humidity in the data table in Postproc, then set the model to WTA wood destruction model and generate the diagram.
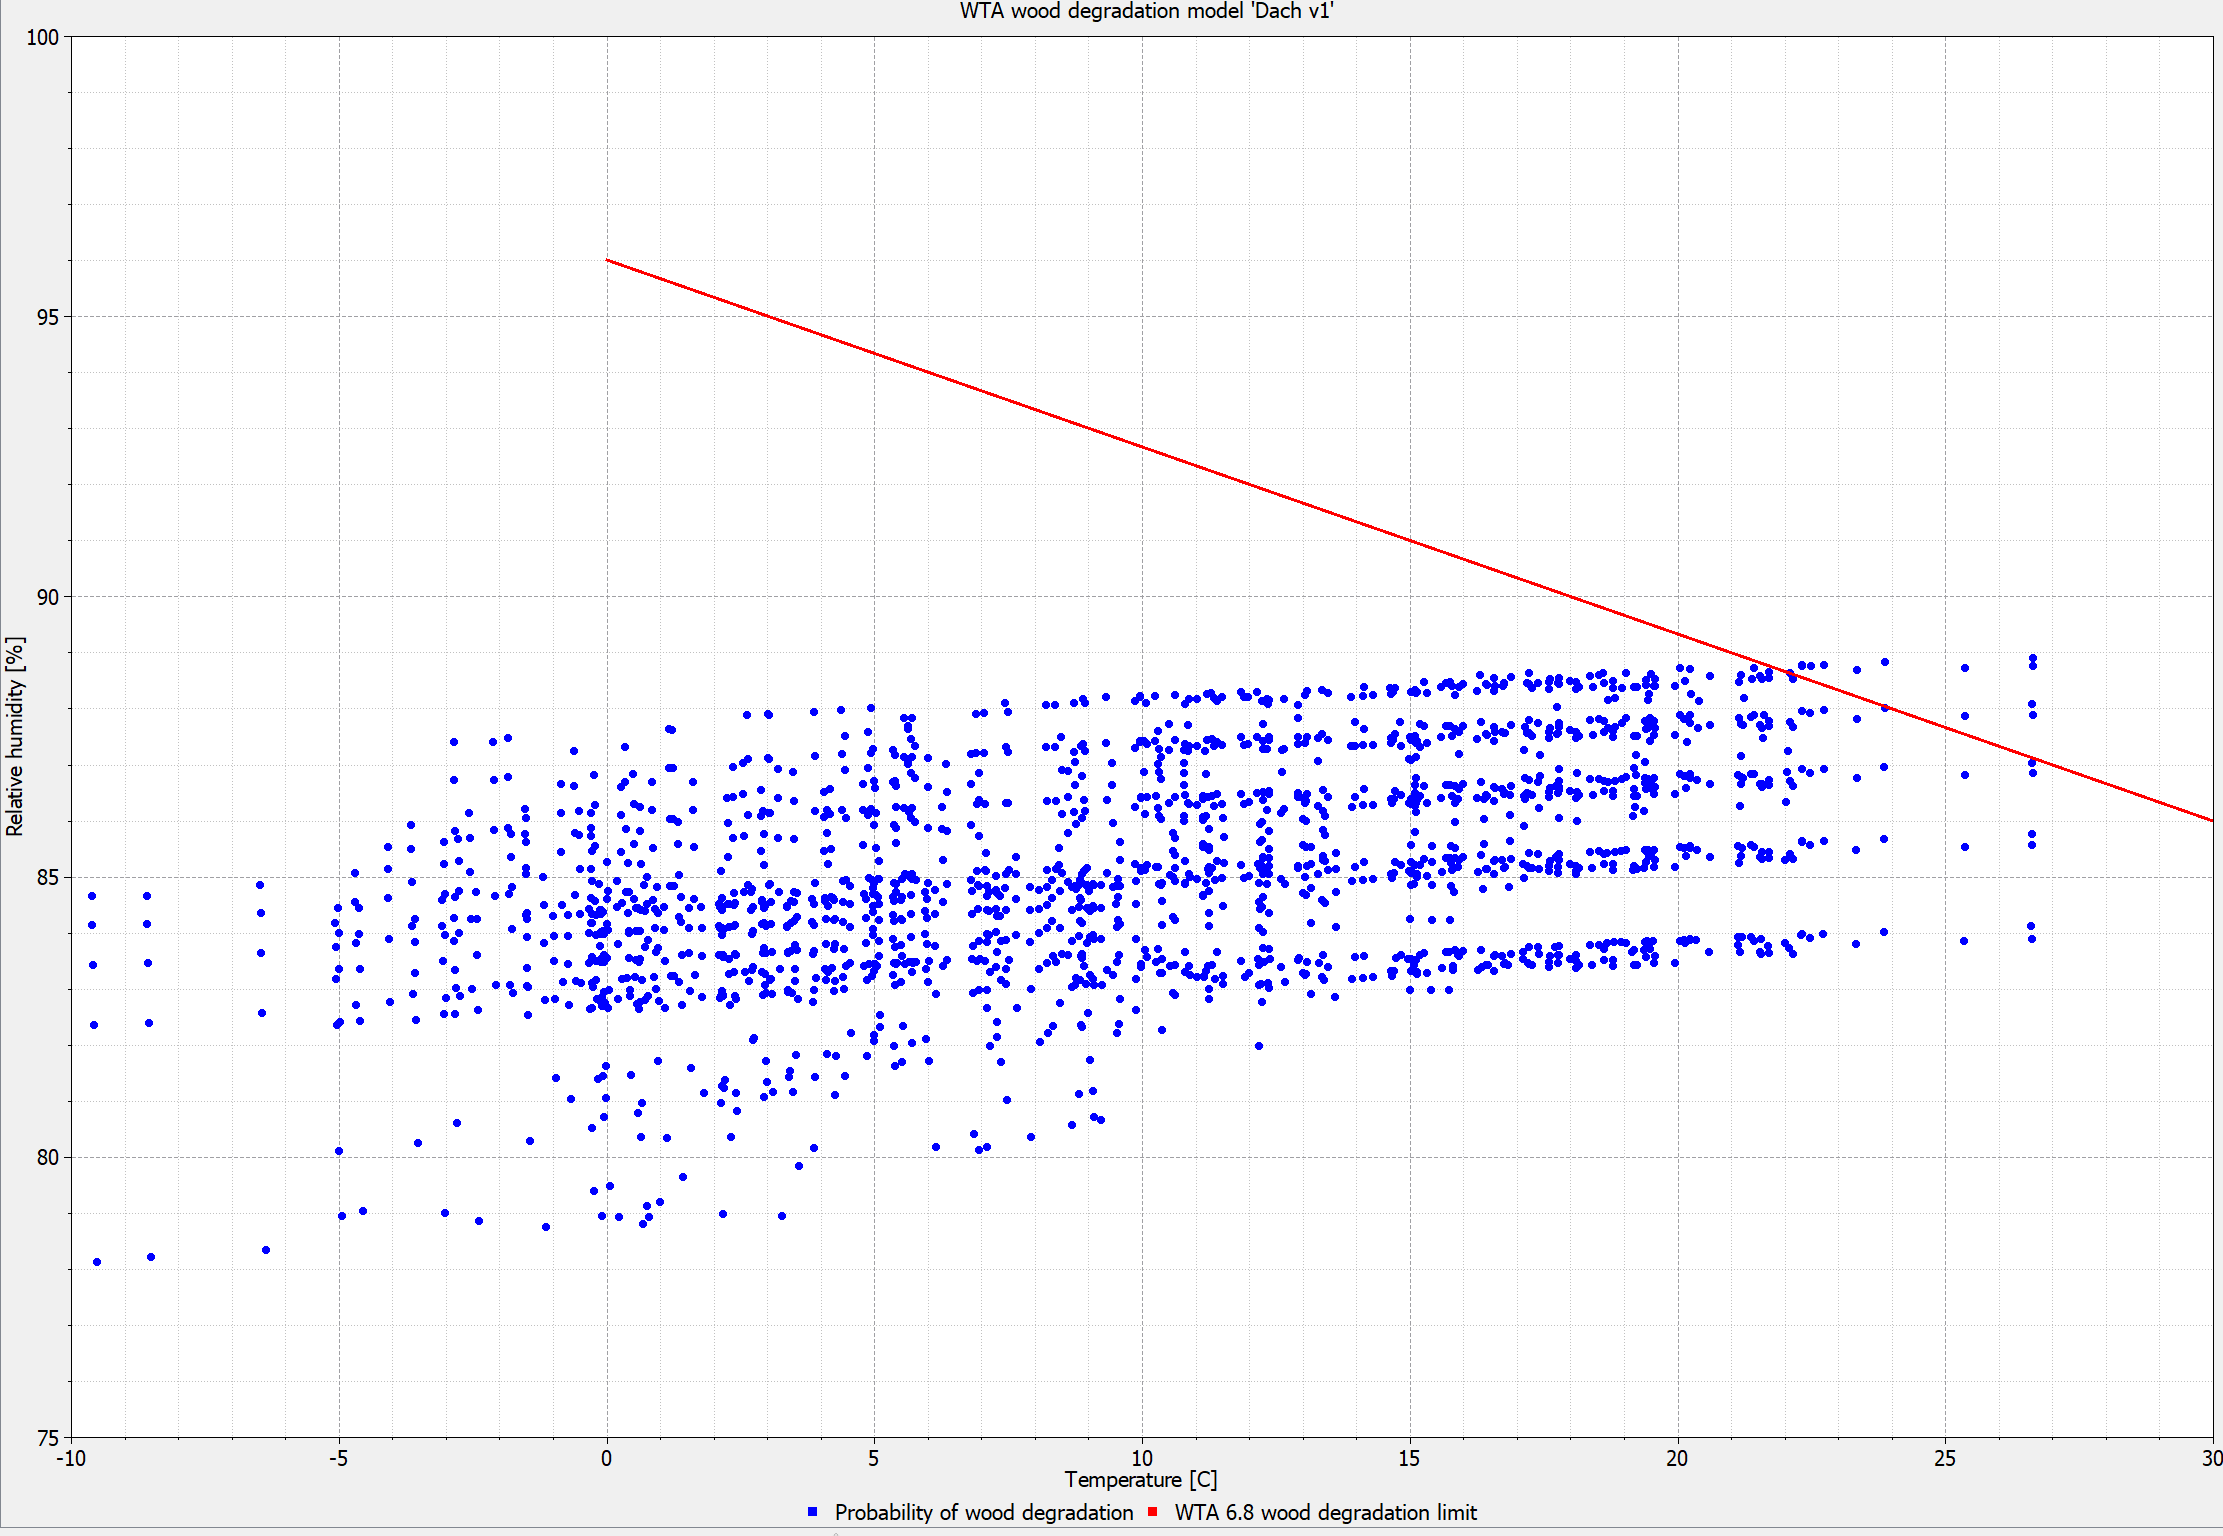
Here, too, you can clearly see that the limit line has been exceeded. This construction would therefore not be permissible.